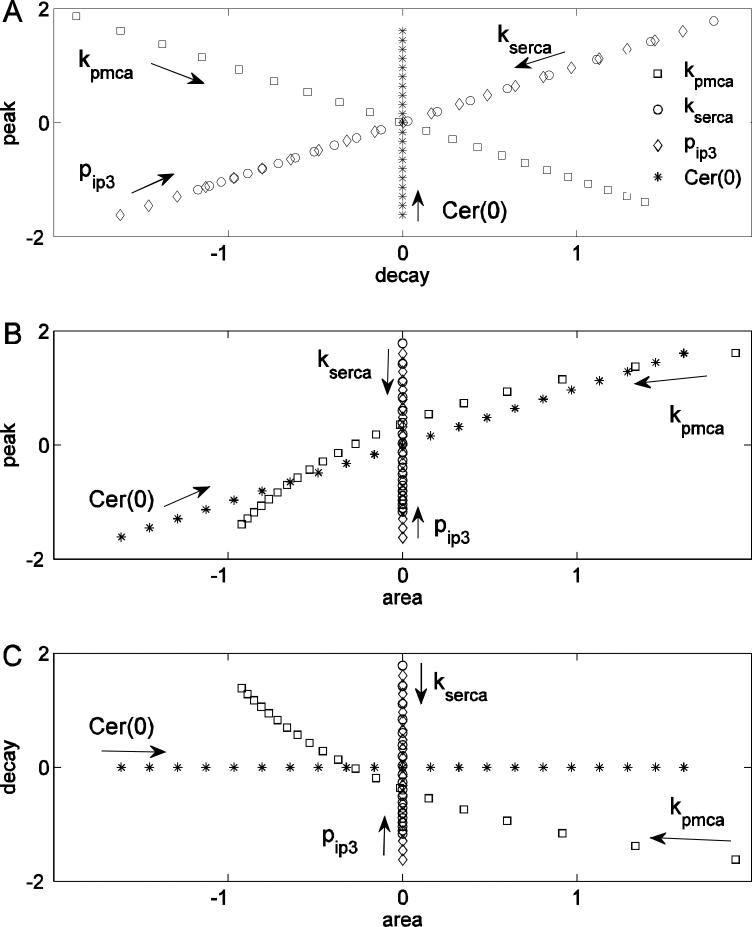
Figure 6.
Single parameter feature scatter plots. (A) Variation of different parameters produces different patterns in the peak-decay rate scatter plot. (B) Variation of kpmca and Cer(0) cause a positive correlation between peak and area, while kserca and pip3 have no effect on the area. (C) Variation of Cer(0) has no effect on the decay rate, kserca and pip3 have no effect on the area, and kpmca variation produces a negative correlation between decay rate and area.

