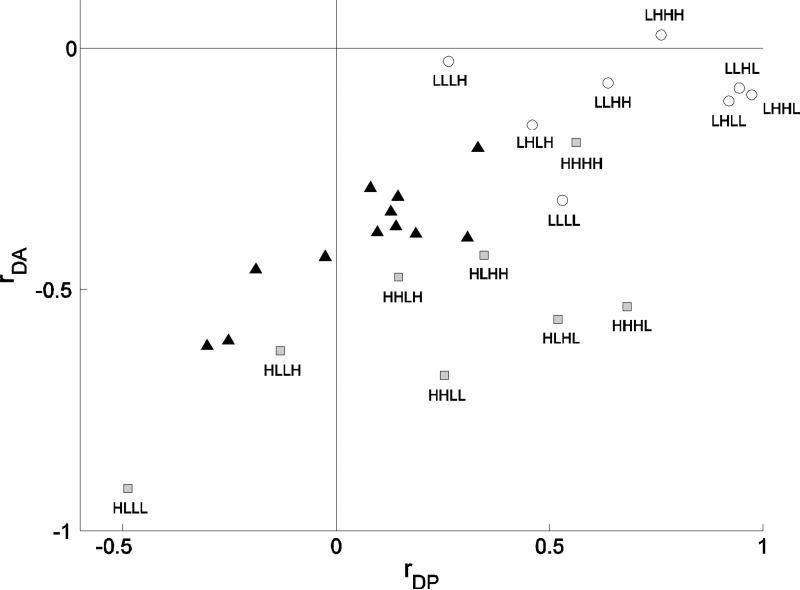
Figure 8.
Comparison between model and experimental results. The x-axis is the value of the correlation between peak and decay rate, the y-axis is the value of the correlation between decays and area. Labels H and L correspond to a parameter value drawn from a high (±50%) and low (±10%) variance distribution, respectively. The order of the parameters is kpmca, kserca, pip3, Cer(0). Model simulations are divided in two categories, the ones in which at least kpmca was chosen from a high distribution (gray filled squares) and all others (open circles). Model correlations are closer to experimental correlations (black filled triangles) when the value of kpmca, Cer(0) and one or no other parameter were drawn from the high variation distribution.

