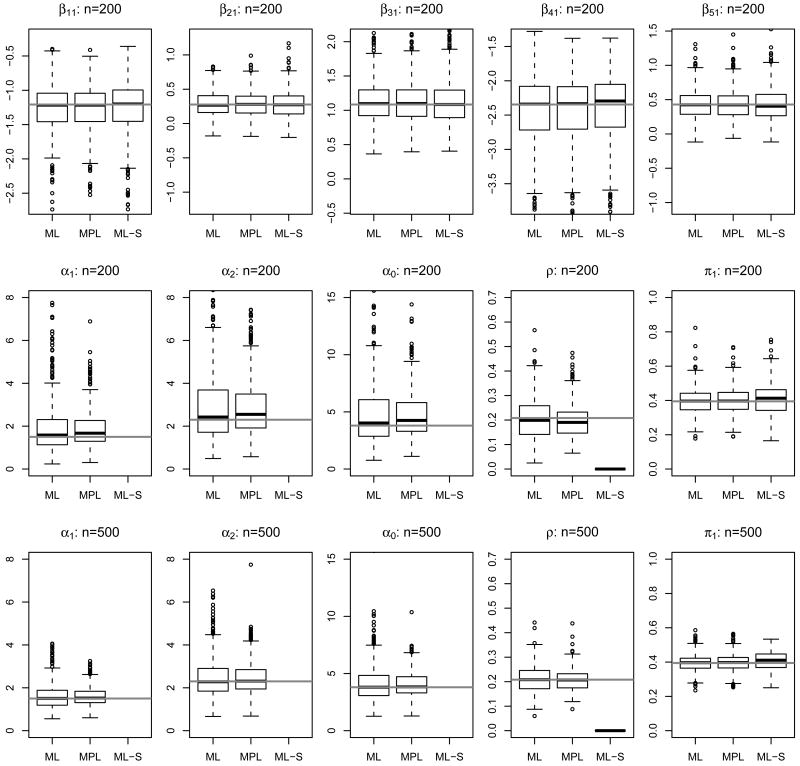
Figure 2.
Boxplots of β and α estimates under Simulation Setting I. “ML” and “MPL” are maximum likelihood and maximum pairwise likelihood estimates from the Dirichlet model (4) and (6), while “ML-S” stands for maximum likelihood estimates from the simple latent class model (4) and (5). In all subfigures, solid gray lines represent true parameter values. The first row displays β estimates from simulations with n = 200. Here we show results for (β11, β21, β31, β41, β51), i.e., the log odds of reporting “1” for five items conditional on class 1, and omit those for class 2 parameters βk2's. The second and third rows show estimates of α parameters from simulations with n = 200 and n = 500, respectively. The five columns correspond to α1, α2, α0 = α1 + α2 (scale parameter), ρ = 1/(1 + α0) (ICC) and π1 = α1/α0 (marginal prevalence of class 1), respectively.

