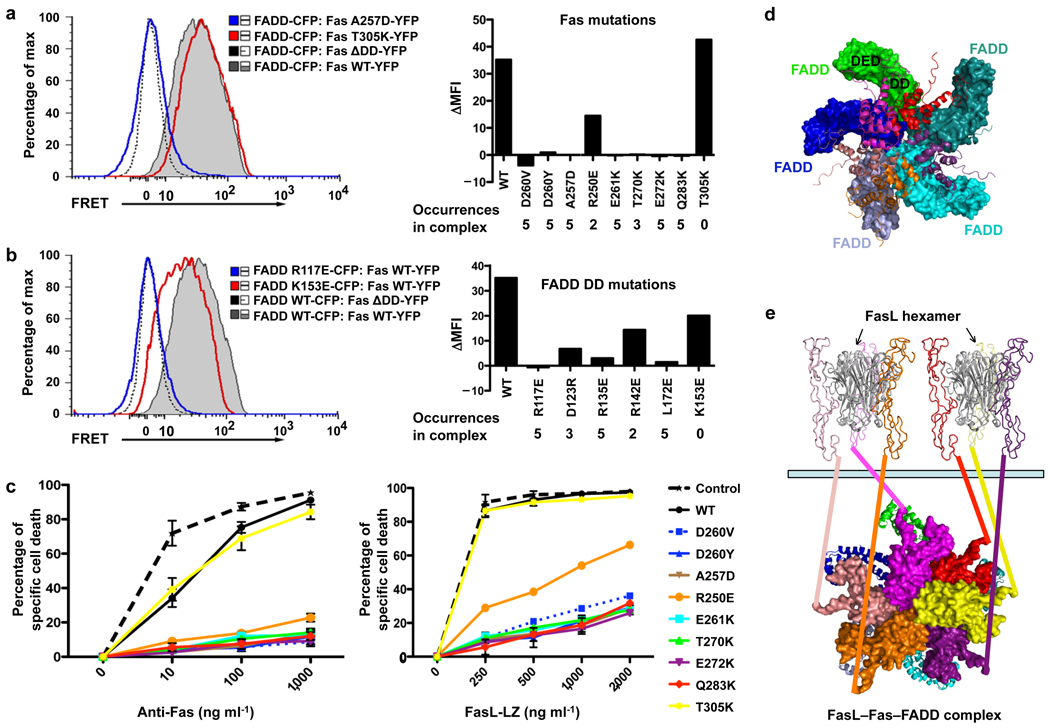
Fig. 4.
Interactions in living cells and functional effects of Fas DD and FADD DD mutations. (a) 293T cells were transfected with CFP-tagged FADD DD and YFP-tagged wild-type or mutant full-length Fas and analyzed for FRET by flow cytometry. Bi-exponential plots of the FRET signals are shown for cells transfected with the indicated constructs. A plasmid encoding a truncated Fas protein without a death domain (Fas ΔDD) was used as a negative control. Change in geometric mean fluorescence intensity (ΔMFI) was calculated by subtracting the MFI of non-interacting proteins (Fas ΔDD with WT FADD DD) from the MFI in the FRET channel of the indicated interacting pair. At right the mean fluorescence intensity relative to FRET signal from the Fas ΔDD–FADD interaction (ΔMFI) is shown for the indicated Fas DD mutants interacting with wild-type FADD. The occurrences of the interactions in the complex are shown. (b) FRET analysis of 293T cells transfected with either wild-type or mutant FADD DD interacting with full-length Fas or Fas ΔDD. At right the ΔMFI is shown for the indicated FADD DD mutants interacting with wild-type Fas. The occurrences of the interactions in the complex are shown. Results shown in (a) and (b) are representative of three independent experiments. (c) Effect of Fas DD mutants on Fas-induced cell death in transfected Jurkat E6.1 cells. Cells were transfected with the indicated constructs and apoptosis was induced with anti-Fas or FasL-LZ. Cell death was assayed by flow cytometry. Results are the average +/− s.e.m. of specific cell death in three independent experiments. (d) The Fas DD–full-length FADD complex model constructed by superimposing FADD DD with the structure of full-length FADD 20. Fas DDs are shown in ribbon diagrams while FADD molecules are shown in surface representations. The location of the FADD DED for caspase-8 recruitment is shown for one of the FADD molecules. (e) A proposed model for post-receptor DISC formation that utilizes FasL hexamerization. All structures are shown in ribbon diagrams except for the intracellular death domains of Fas, which are shown in surface representations. The two FasL trimers are shown in gray. The six Fas extracellular domains are shown in the same color as their intracellular death domains. A 6th Fas intracellular death domain (yellow) was added to the crystal structure. The extracellular and the intracellular domains are connected via straight lines of the same colors. Full-length FADD molecules are shown in ribbon diagrams. The light green bar represents the cellular membrane.

