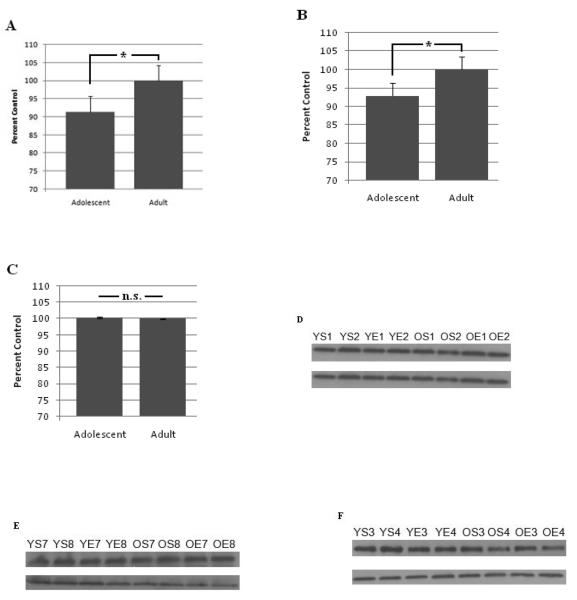
Figure 4. Adolescent rats have less PKCγ expression in the cerebellum and cortex, but not hippocampus, compared to adult rats.
Optical density of PKCγ expression normalized to β-actin (adult set as control condition) in (A) the cortex, (B) cerebellum, and (C) hippocampus. Representative PKCγ expression (top) and β-Actin expression (bottom) in the (D) cortex, (E) cerebellum, and (F) hippocampus. YS = adolescent saline, YE = adolescent ethanol, OS = adult saline, OE = adult ethanol, and the number indicates animal number. Error bars indicate S.E.M. and * p < 0.05.

