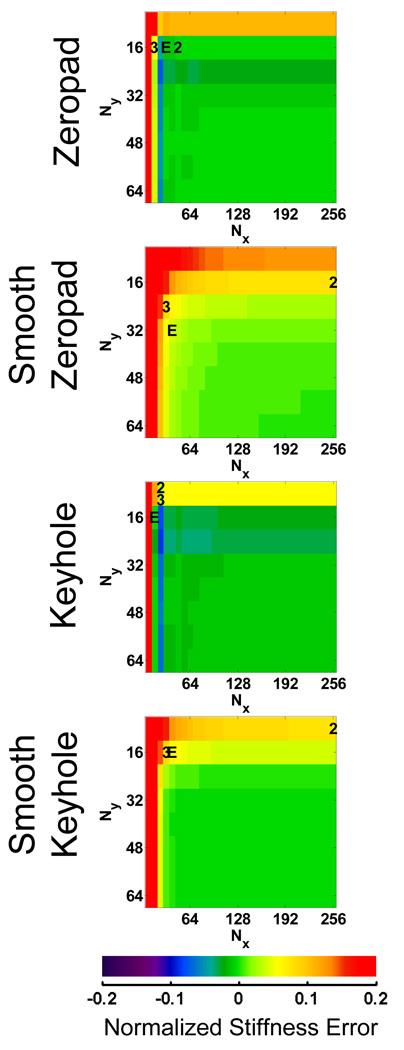
Figure 3.
Normalized error maps for each data reduction method using the FEM data. These maps are used to find subsamplings or image acquisition matrices that meet the 10% tolerance and minimize Tacq. The data set that minimized Tacq for each of the three acquisition methods is denoted by “2” (2D), “3” (3D) or “E” (EPI).

