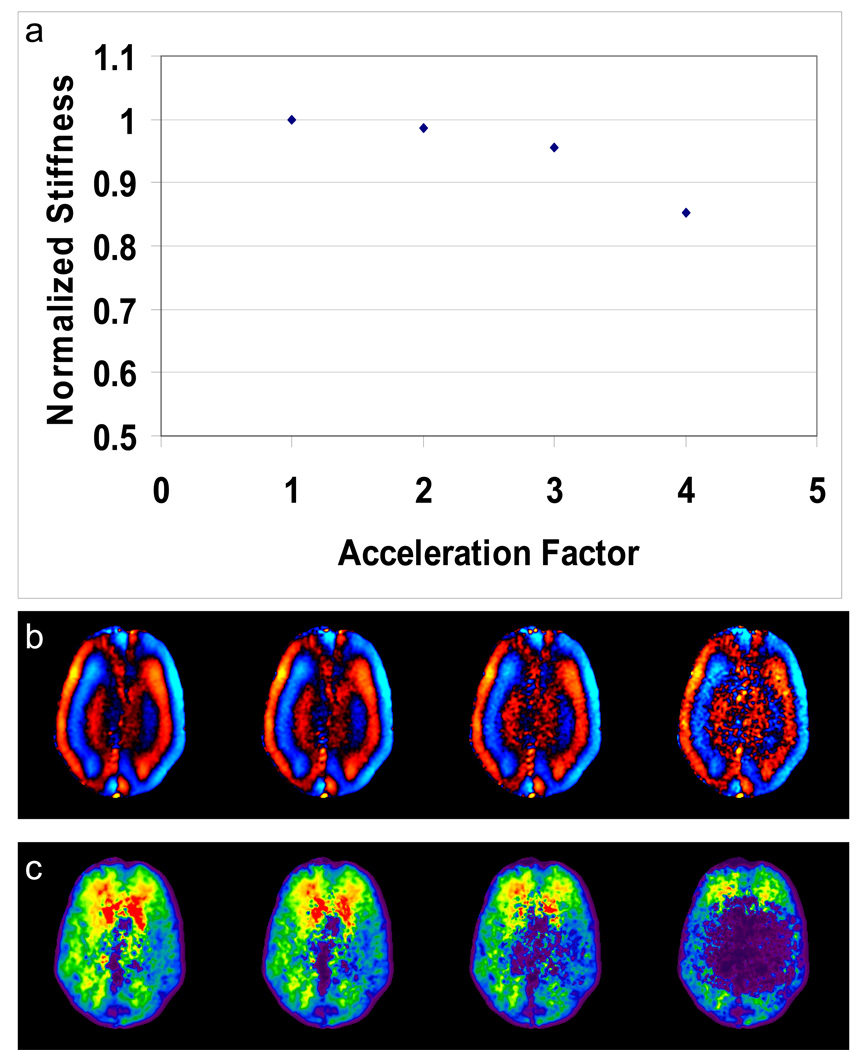
Figure 4.
In vivo brain MRE data simulated with 4 different SENSE acceleration factors. (a) A plot of normalized mean stiffness versus acceleration factor with no k-space truncation. Example wave images (b) and elastograms (c) obtained with R = 1, 2, 3, and 4 show how the stiffness decreases with increasing acceleration, likely due to the decrease in SNR.

