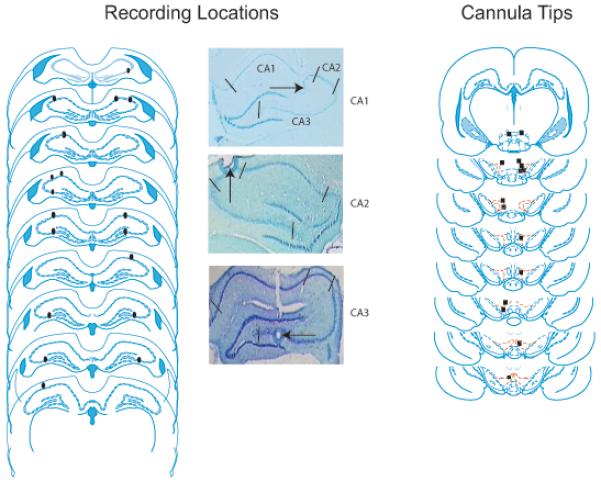
Figure 2.

A. Reconstructed HPC recording locations and individual examples of lesions in CA1, CA2, and CA3 subregions of HPC. CA1, CA2, and CA3 subregions of HPC are outlined in the top figure of the CA1 lesion example. B. Locations of VTA cannula tips. The cannula tips in the rat represented by the first plate were not considered to be close enough to VTA, therefore the baclofen infusion data from this rat was excluded from analysis. Reconstructed from Paxinos and Watson, 2009.
