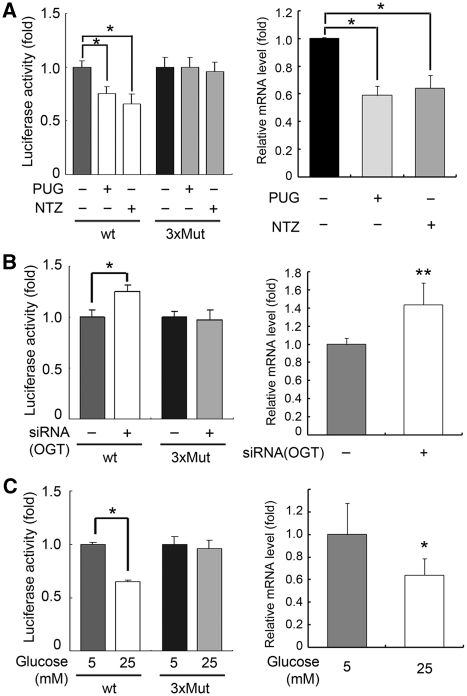
Figure 5.
O-GlcNAc modification on Snail1 regulates E-cadherin expression. (A) Left panel: gene reporter assay for wt or 3xMut E-cadherin promoter in the presence (+) or absence (−) of OGA inhibitors PUGNAc or NAG-Thiazoline under normoglycaemic conditions (n=3, data are presented as mean±s.d., *P<0.01 by Student's t-test). Right panel: quantitative real-time (RT)–PCR for E-cadherin mRNA in the presence (+) or absence (−) of OGA inhibitors PUGNAc or NAG-Thiazoline under normoglycaemic conditions (n=4, data are presented as mean±s.d., *P<0.01 by Student's t-test). GAPDH was used for normalization. (B) Left panel: gene reporter assay for wt or 3xMut E-cadherin promoter following siRNA knock-down of OGT under hyperglycaemic conditions (n=3, data are presented as mean±s.d., *P<0.01 by Student's t-test). Right panel: quantitative RT–PCR for E-cadherin mRNA after siRNA knock-down of OGT hyperglycaemic conditions (n=3, data are presented as mean±s.d., **P<0.02 by Student's t-test). GAPDH was used for normalization. (C) Left panel: gene reporter assay for wt or 3xMut E-cadherin promoter under normoglycaemic (5 mM) or hyperglycaemic (25 mM) conditions (n=3, data are presented as mean±s.d., *P<0.01 by Student's t-test). Right panel: quantitative RT–PCR for E-cadherin mRNA under normo- or hyperglycaemic conditions (n=4, data are presented as mean±s.d., *P<0.01 by Student's t-test). GAPDH was used for normalization.

