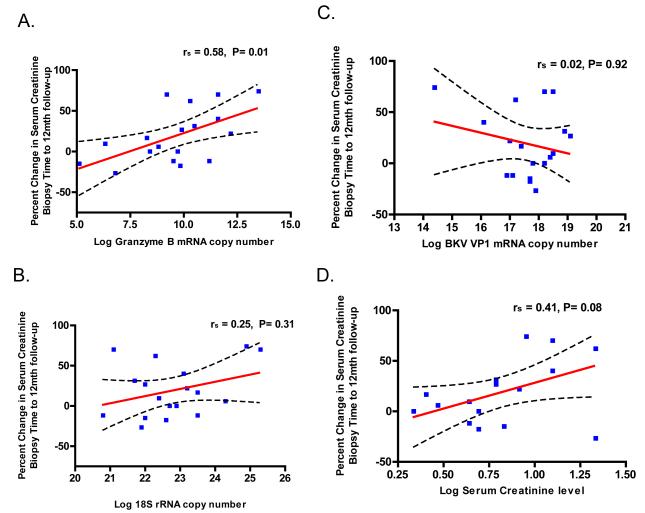
Figure 3. Correlation between the Change in Renal Allograft Function and Transcript Levels or Serum Creatinine.
The relationships between the percent changes in serum creatinine levels 12 months following BKVN diagnosis and the levels of mRNAs in urine specimens or serum creatinine levels, measured at the time of allograft biopsy, are shown, along with Spearman’s rank-order correlation. The percent change in serum creatinine levels were calculated using the formula: 100 × (12 month post biopsy creatinine – creatinine at the time of biopsy / 12 month post biopsy creatinine). A significant positive relationship between the percent change in serum creatinine levels and urinary cell levels of granzyme B mRNA (Panel A). The relationship between the percent change in serum creatinine and levels of mRNA for 18S rRNA (Panel B), BKV-VP1 mRNA (Panel C) and levels of serum creatinine at the time of biopsy (Panel D) are also shown. The graphs display the best-fit line (solid) and the 95% confidence band for the line, indicating the boundaries of all possible straight lines.

