
Figure 1. Plexin gene copy numbers in melanomas and PDACs.
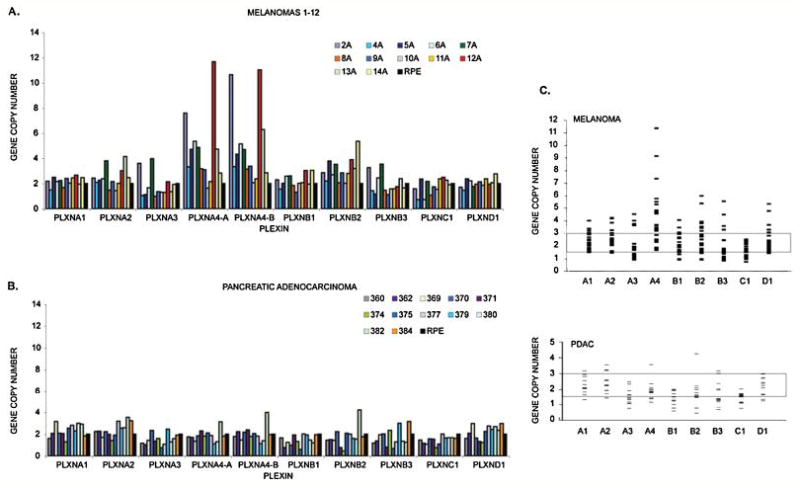
We performed Quantitative Real Time PCR with genomic DNA derived from twenty-four melanomas and twelve PDACs, using plexin-specific probes. The figure shows: A, copy number results for the first 12 melanomas (results for the next 12 melanomas are reported in detail in Supp. Figure S1) and B, the twelve PDACs. The nine plexins are indicated on the X-axis (A1 through D1). The Y-axis shows copy numbers after normalization with control DNA (RPE cells). Panel C summarizes the results of copy number analysis of the plexin gene family. Each small bar represents an individual case. Gene copy numbers below 1.5 and above 3 (highlighted range) are normally considered as aberrant.