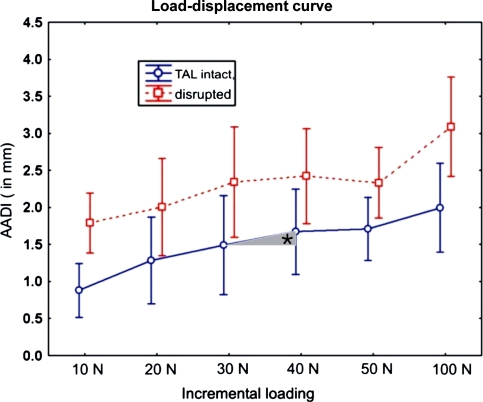
Fig. 3.
The displacement of C1 on C2 in terms of the radiographically assessed AADI in the TAL-intact state (solid line) and TAL-disrupted state (dotted line). Differences just yielded significance for the initialization of forces at 10 N (P = 0.02) and at 100 N loading (P = 0.049). The asterisk marks the increase or decrease of the AADI at each incremental loading expressed as Δload–displacement (mm)

