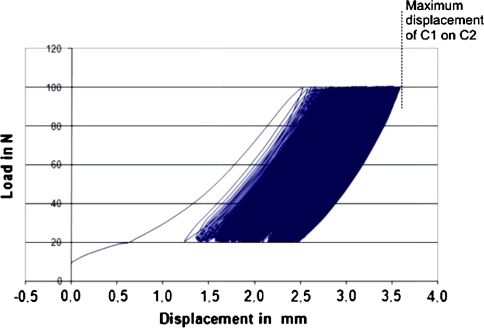
Fig. 4.
Load–displacement curve of one specimen during cyclic loading. After testing on the TAL-intact state, all specimens were subjected to cyclic loading with the TAL transsected. Maximum displacement under physiologic loading, ramping from 20 to 100 N, was 3.6 ± 1.19 mm (range 2.01–5.33 mm) on average

