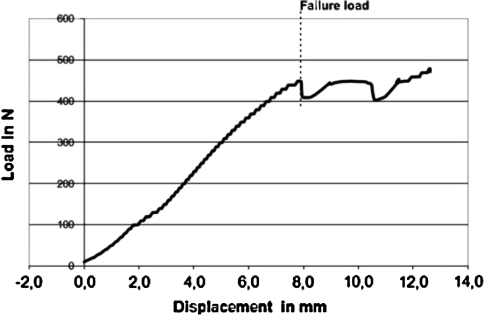
Fig. 6.
Failure-load curve of one tested C1-ring osteosynthesis with TAL disrupted. The load–displacement tracing illustrates a continuous load–displacement curve increasing until the system fails (here under loads >400 N at a displacement of about 8 mm). At the instant of partial functional failure of some of the secondary restraints, the forces reach a peak and decline momentarily, then rise again as the forward shift of C1 continues and the remaining functionally active parts of the auxiliary ligament system come under load

