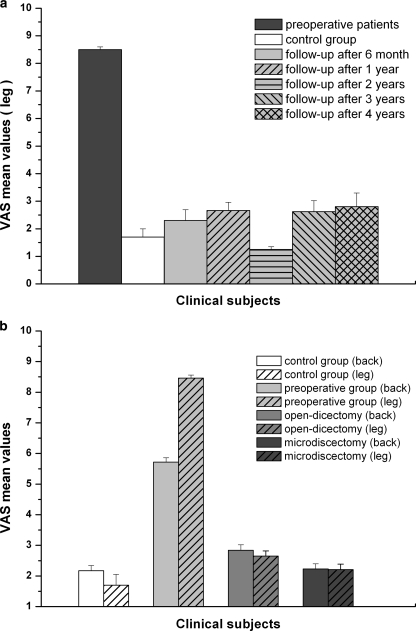
Fig. 3.
a, b The statistically significant (p < 0.05) VAS changes (means ± SE) in the low back and leg compared between the pre- and postoperative ones at all follow-up assessment time points. Statistically insignificant (p > 0.05) changes in both pain areas compared to the CG. c Bar graph delineating CG, pre- and postoperative (MD and OD methods) VAS pain outcomes (means ± SE) in both pain areas. Statistically significant differences were found in all variables (p < 0.05), except among MD and OD subgroups (p > 0.05)

