
Figure 4.
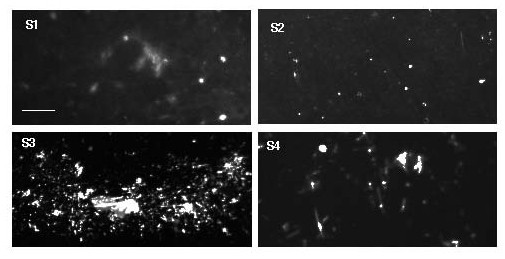
Representative fluorescence images of F-actin in CSF pellets labeled with rhodamine - phalloidin. Each panel (S1-S4) represents sample collected from different MS patients.Scale bars = 20 μm.
Official websites use .gov
A
.gov website belongs to an official
government organization in the United States.
Secure .gov websites use HTTPS
A lock (
) or https:// means you've safely
connected to the .gov website. Share sensitive
information only on official, secure websites.
Representative fluorescence images of F-actin in CSF pellets labeled with rhodamine - phalloidin. Each panel (S1-S4) represents sample collected from different MS patients.Scale bars = 20 μm.