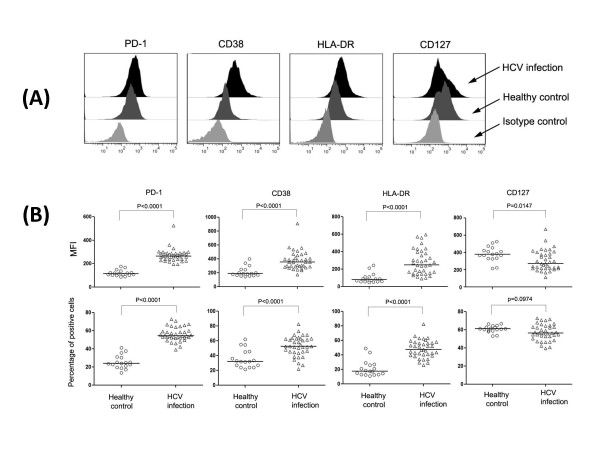
Figure 2.
Comparison of PD-1, CD38, HLA-DR and CD127 expression on total CD8+ T cells in HCV-infected patients. (A). Representative histogram showing different patterns of PD-1, CD38, HLA-DR and CD127 expression on whole CD8+ T cells in chronic HCV (dark area) infection, healthy controls (dark grey area) and isotype antibodies controls (grey area). (B). Statistic analysis of PD-1, CD38, HLA-DR and CD127 expression on total CD8+ T cells in chronic HCV (△) infection and healthy controls (○). Data were presented as mean fluorescence intensity (MFI) (top panel) and percentage of positive cells (low panel). Graphs showed vertical scatter plots and median lines.

