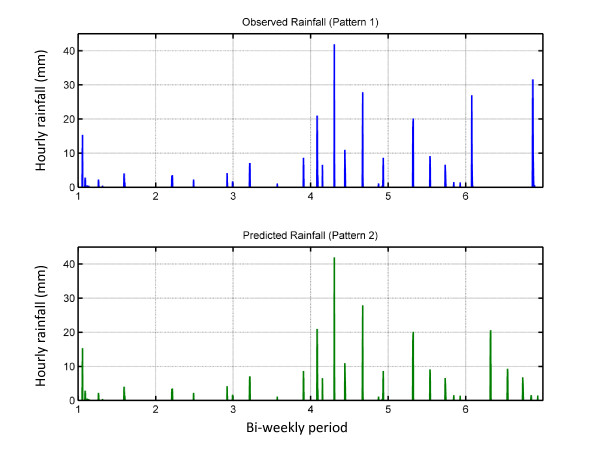
Figure 3.
Rainfall Inputs for the 6th Bi-weekly Period of the 2006 rainy season. The first plot shows observed hourly rainfall. The second graph shows the predicted rainfall series. This series uses observed rainfall from the first five bi-weekly period, followed by a prediction for the following two weeks, made by repeating the pattern of rainfall observed during the fifth bi-weekly period, scaled such that the total volume is equal to the mean volume for that period.

