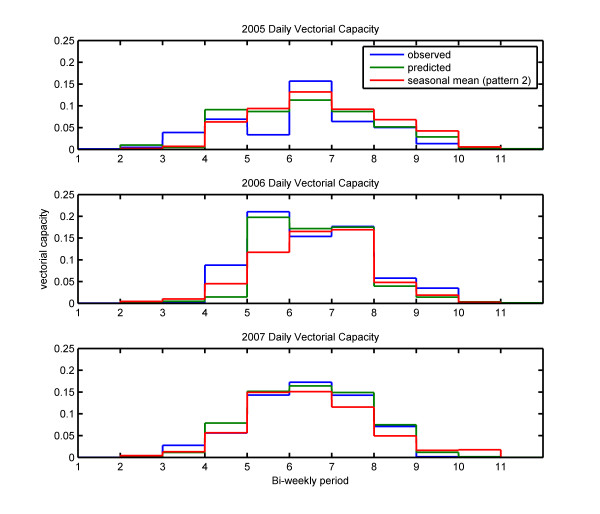
Figure 7.
Simulated vectorial capacity. Mean vectorial capacity for each two-week period during the rainy seasons of 2005, 2006 and 2007 with the simulations forced by observed rainfall (pattern 1) in blue, 2-week prediction rainfall series (pattern 2) in green, and seasonal mean (pattern 2) rainfall series in red.

