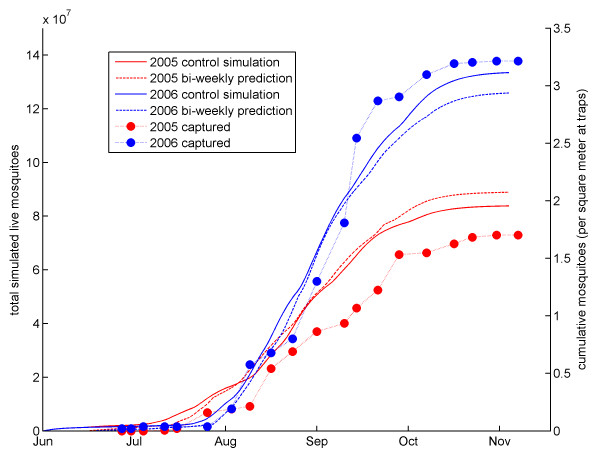
Figure 8.
Comparison with field observation. 2005 data are shown in red, and 2006 data are shown in blue. The solid line represents adult mosquitoes modelled in the control simulation, the dashed line shows adult mosquitoes in the bi-weekly prediction simulation. The circles show mosquitoes captured in the field, corrected for moon phase.

