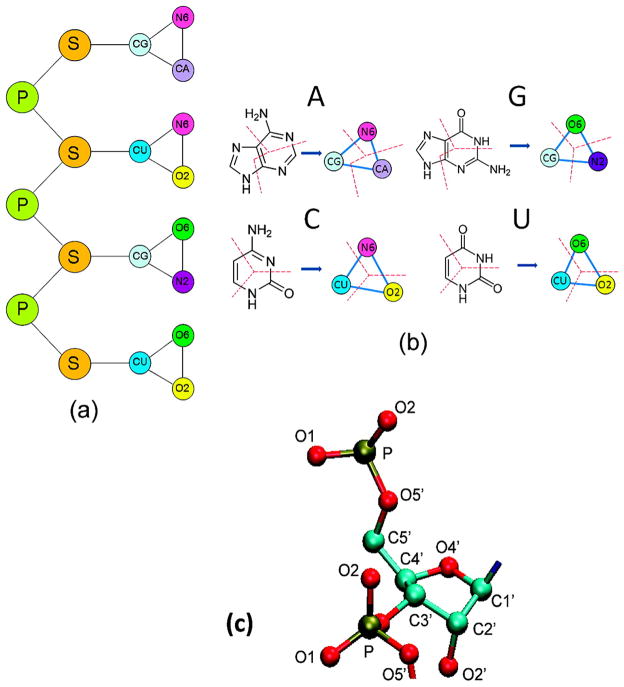
Figure 1.
(a) Schematic representation of the CG model for RNA. Phosphate and sugar are represented as one CG particle. The bases A, G, C, and U are represented as three CG particles for each. (b) The components of each CG base. The base is divided by the red dash line. (c) Schematic representation of all-atom RNA backbone.

