Figure 3.
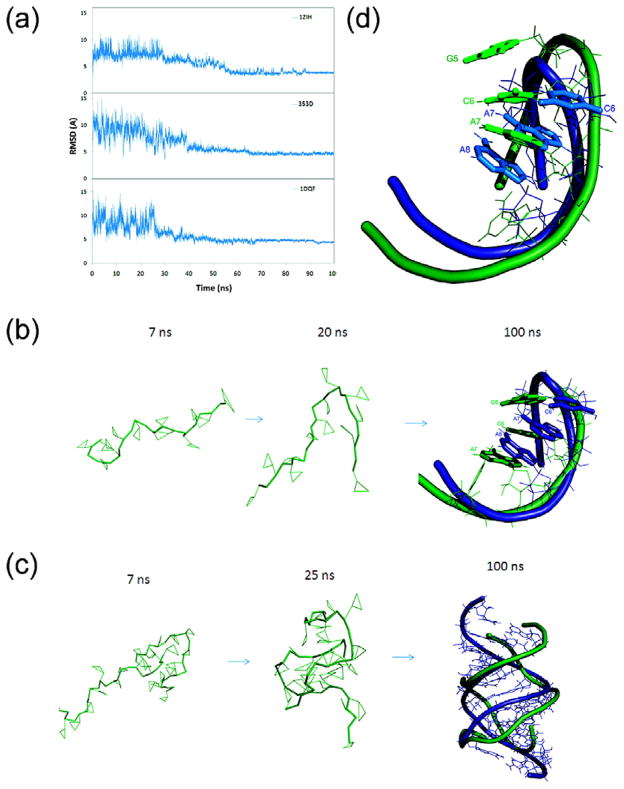
(a) Comparison of all-atom RMSDs for the structures 1ZIH, 353D and 1DQF during the 100 ns simulated annealing simulations. The simulation temperature was increased to 1,000k within the beginning 2,000 steps and then cooled down to room temperature 298k. The RMSDs were calculated using all of the CG atoms. The figures show how the RNA molecules fold toward to their native structures. (b) Snapshots taken from simulated annealing of 1ZIH. (c) The superposition of final conformation (colored green) and native structure (colored blue) of GCCA tetraloop after 20 ns full-atom MD refinement. The backbone is represented as a ribbon and the base-stacking unit in tetraloop is shown as sticks. (d) Snapshots taken from simulated annealing simulation of 353D.

