
Figure 4. E-cadherin protein levels are correlated to Pten level.
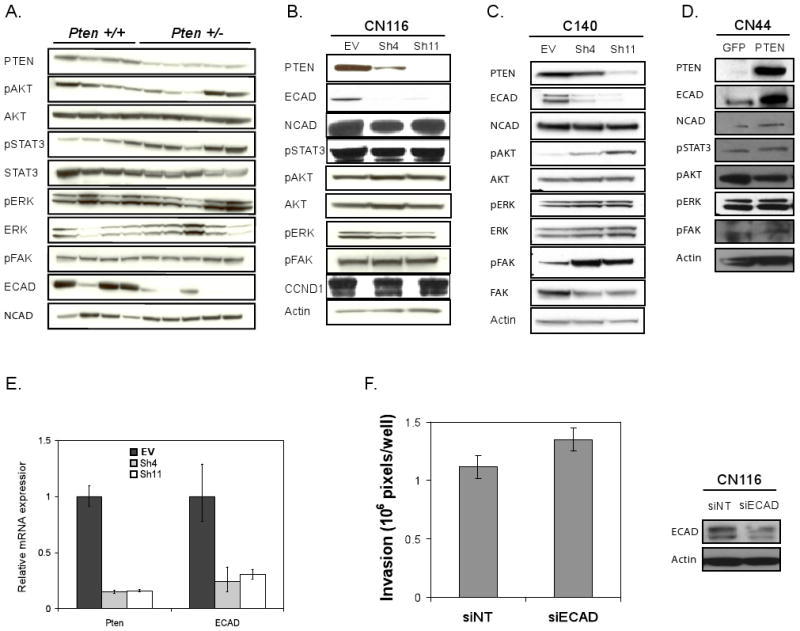
(A) Molecular profile comparison of Ras-Ink4a/Arf Pten+/+ and Pten +/- early passage melanoma cell lysates by immunoblotting with antibodies labeled on left. The corresponding Pten genotype is shown on top of the blot. E-cadherin protein levels are lower on Pten +/- melanoma cells compared to on Pten +/+ cells. (B-D) Immunoblot analysis CN116 (B) and C140 (C) with EV, sh4, or sh11, and CN44 (D) cells with GFP or PTEN expression with antibodies indicated. (E) Real time rt-PCR analysis of Pten and E-Cadherin expression in CN116 cells with EV, Sh4, or Sh11. (F) Boyden chamber assay (left) of CN116 cells following siRNA-mediated E-Cadherin downregulation (siECAD) compared to non-targeting control (siNT) and western blot analysis (right).