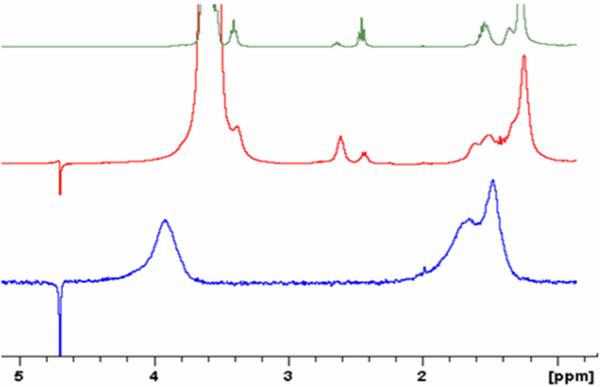
Figure 1.
NMR comparison of PEG ligand (top), PEG-ylated TMPC (middle), and original TMPC (bottom). Signature line broadening is present in both the original TMPC and PEG-ylated TMPC spectra, signifying the nanoparticles remained intact after place-exchange. Common to both the PEG ligand and the PEG-ylated TMPC are the two peaks at 2.5 ppm and 2.65 ppm, signifying that the TMPC was in fact PEG-ylated; the broadening of the signature PEG peaks denotes the ligand is attached to the particle and not simply free in solution.

