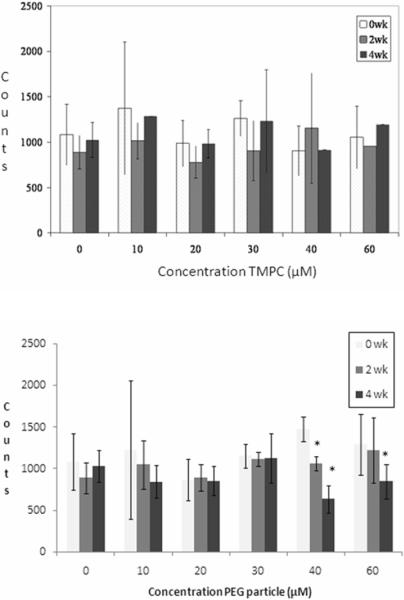
Figure 4.
Coulter Counter analysis for original TMPC (top) and PEG-ylated TMPC (bottom). Graphical representation of ratio of RBC count: WBC count. No statistically relevant change is noted in the RBC or WBC count or their ratio; therefore, it may be assumed that the TMPC does not invoke an immune response at any concentration. However, a noticeable decline in WBC count is shown at concentrations of 40 and 60 μM for the PEG-ylated TMPCs, indicating an immune response at high concentrations. Asterisk indicates significantly different values (p < 0.01).

