Abstract
Background
Bioluminescence imaging (BLI) permits the noninvasive quantitation and localization of transduction and expression by gene transfer vectors. The tendency of tissue to attenuate light in the optical region, however, limits the sensitivity of BLI. Improvements in light output from bioluminescent reporter systems would allow the detection of lower levels of expression, smaller numbers of cells and expression from deeper and more attenuating tissues within an animal.
Methods
With the goal of identifying substrates that allow improved sensitivity with Renilla luciferase (RLuc) and Gaussia luciferase (GLuc) reporter genes, we evaluated native coelenterazine and three of its most promising derivatives in BLI of cultured cells transduced with retroviral vectors encoding these reporters. Of the eight enzyme-substrate pairs tested, the two that performed best were further evaluated in mice to compare their effectiveness for imaging vector-modified cells in live animals.
Results
In cell culture, we observed striking differences in luminescence levels from the various enzyme-substrate combinations and found that the two luciferases exhibited markedly distinct abilities to generate light with the substrates. The most effective pairs were RLuc with the synthetic coelenterazine derivative ViviRen, and GLuc with native coelenterazine. In animals, these two pairs allowed similar detection sensitivities, which were 8–15 times higher than that of the prototypical RLuc-native coelenterazine combination.
Conclusions
Our results demonstrate that substrate selection can dramatically influence the detection sensitivity of RLuc and GLuc and that appropriate selection of substrate can greatly improve the performance of reporter genes encoding these enzymes for monitoring gene transfer by BLI.
Keywords: imaging, reporter gene, bioluminescence, luciferase, coelenterazine, retrovirus
Introduction
The development of more effective gene transfer techniques remains a fundamental goal in gene therapy research. Improvements in methods for noninvasively tracking and quantitating gene delivery and expression could greatly facilitate the development of better vectors and delivery strategies. For this purpose, noninvasive bioluminescence imaging (BLI) stands out as particularly attractive due to its relatively high sensitivity, speed, ease of employment, and low cost [1–2]. In BLI, a cooled charge-coupled device camera is used to detect the emission of light from cells or tissues expressing a luciferase reporter protein. This light is generated when the luciferase catalyzes oxidation of its substrate using molecular oxygen.
The most widely used luciferases are those of the firefly Photinus pyralis, and the sea pansy Renilla reniformis. Whereas firefly luciferase (FLuc) uses D-luciferin as substrate, the luciferases of Renilla (RLuc) and other bioluminescent marine organisms use coelenterazine. The cDNA for the marine copepod Gaussia princeps [3] was found to be capable, after codon optimization, of mediating levels of luminescence in combination with coelenterazine much higher than those of a humanized RLuc gene and comparable to those of a humanized FLuc gene in combination with D-luciferin [4]. Like RLuc, Gaussia luciferase (GLuc) catalyzes the oxidation of coelenterazine to produce a broad spectrum of light with a peak around 480 nm [5–6]. While GLuc is secreted and released into the circulation in animals [7], it is nevertheless effective for imaging tissues expressing the enzyme [4].
RLuc and GLuc offer unique advantages over FLuc for imaging gene transfer and expression. One is the relatively small size of the marine luciferases. Compared to the coding sequence of FLuc, which is 1653 bp, those of RLuc and GLuc are compact, at 936 and 558 bp, respectively. The marine luciferases are therefore well suited for applications in which short transgene sequences are required. Another advantage is that, unlike FLuc, the marine enzymes do not require ATP as a cofactor and may thus be used for imaging transduced cells and tissues independently of their metabolic state and are less likely to perturb the cells in which they are expressed [2, 8]. Since coelenterazine-utilizing luciferases do not catalyze D-luciferin oxidation and FLuc does not catalyze coelenterazine oxidation, these reporters may also be combined with FLuc for dual labeling [8].
A disadvantage of RLuc and GLuc relative to FLuc for BLI is that a greater proportion of the light produced by the marine luciferases is absorbed by tissue. Tissue chromophores, such as hemoglobin, most efficiently absorb wavelengths below 600 nm [9]. Since more of the FLuc emission spectrum, which peaks at 562 nm, is above 600 nm, more of its signal can reach the animal’s surface. As a result, the utility of RLuc and GLuc as reporters for in vivo BLI could in particular benefit from improvements in signal intensity. An overall increase in light output by RLuc and GLuc would be beneficial primarily by raising the level of light in the longer-wavelength regions of their spectra. Previous efforts at enhancing the performance of RLuc for BLI involved the engineering of mutants that are more stable and produce brighter and red-shifted light [10–11].
A large number of analogs of native coelenterazine (clzn-n) have been synthesized and tested for their capacity to generate light in vitro with RLuc [12–13]. Zhao et al. evaluated several of these analogs with cells expressing RLuc and found that coelenterazine-f (clzn-f) and coelenterazine-h (clzn-h) produced stronger luminescence than clzn-n while exhibiting autoluminescence levels similar to that of the native substrate [14]. A variant of clzn-h called ViviRen, which bears protected oxidation sites, is sold by Promega Corporation [15]. The ester protecting groups are cleaved intracellularly by endogenous esterases, thereby rendering the substrate available for catalysis by a luciferase. ViviRen has been reported to yield higher luminescence levels with RLuc in vitro and in vivo than clzn-n [16].
Due to the minimal homology between RLuc and GLuc [6], we suspected that their abilities to generate light with different coelenterazine-based substrates would be distinct and that optimization of pairing between enzyme and substrate could readily improve the effectiveness of reporter genes encoding these proteins for BLI of gene transfer. In this study, we evaluated clzn-n, clzn-f, clzn-h, and ViviRen with respect to their autoluminescence properties and their ability to generate light from live cells transduced with replication-competent retroviral (RCR) vectors expressing RLuc or GLuc. We then evaluated the two most promising pairs from this group, RLuc/ViviRen and GLuc/clzn-n, in BLI of mice.
Materials and Methods
Plasmids
Plasmids pAZ3-RLuc and pAZ3-GLuc, which contain full-length, amphotropic MLV proviruses bearing IRES-luciferase cassettes inserted immediately after the env stop codon, were derived from plasmid pAZ3-GFP. pAZ3-GFP is a modified version of plasmid pAZE-GFP [17]. Details of the modifications will be provided upon request and consist, briefly, of removal of MLV 5′ UTR sequence present downstream of the 3′ long terminal repeat, addition of a unique MluI site at the 5′ end of the IRES and the replacement of a short region of ecotropic sequence at the 3′ end of the env gene to render the entire env sequence of amphotropic 4070A MLV origin. The luciferase sequences were PCR amplified from plasmids pCMV-GLuc-1 (Nanolight Technologies) and phRL-CMV (Promega), respectively. The forward and reverse primers for RLuc were 5′-TAATATGGCTTCCAAGGTGTACGA-3′ and 5′-GGGCCGGCGGCCGCTTACTGCTCGTTCTTCAGC-3′, respectively, and those for GLuc were 5′-TAATATGGGCGTCAAAGTTCTGTTTGCCCTG-3′ and 5′-TAACTTGCGGCCGCTCAGTCGCCTCCGGCCCCCTTGATCTTG-3′. The PCR products were digested with NotI and ligated into the PsiI and NotI sites of pAZ3-GFP, replacing the green fluorescent protein (GFP) gene.
Cell culture and transfections
293T and PC-3 cells were obtained from the American Type Culture Collection and grown in Dulbecco’s modified Eagle’s medium (DMEM) and RPMI 1640, respectively, supplemented with 10% fetal bovine serum and antibiotics. For transient transfection of PC-3 cells with pAZ3-RLuc or pAZ3-GLuc for luciferase assays, FuGENE 6 (Roche) was used according to the manufacturer’s recommendations and GFP expression plasmid pGFPemd-cmv-R-control was cotransfected for normalization for transfection efficiency. Forty-eight hours post-transfection, the cultures were imaged as described below and transfection efficiency was determined by flow cytometry for GFP with an EPICS XL flow cytometer (Beckman Coulter).
Virus production, titration and infections
Virus was produced as described previously [18] by transfection of 293T cells with vector plasmid using Lipofectamine 2000 (Invitrogen). Virus titers were determined by measurement of the reverse transcriptase (RT) activity of the 293T transfection supernatants with a Quan-T-RT kit (GE Healthcare) as previously described [19] and by comparison of the activities to those of AZ3-GFP transfection supernatants of known GFP-transducing titer. Infections were performed at a multiplicity of infection (MOI) of 1 and when the cells were at approximately 25% confluence. The infections were allowed to proceed for 10 days and complete transduction was confirmed at that point by failure, due to superinfection resistance, of AZ3-GFP added to an MOI of 2 to transduce any cells as determined by flow cytometry for GFP three days later.
Virus copy number analysis
To determine the numbers of integrated virus copies in the fully transduced PC-3 cells, we used a real-time quantitative PCR assay to detect the MLV pol gene in genomic DNA. The primer and probe sequences used were as follows: forward primer, 5′-AACAAGCGGGTGGAAGACATC-3′; reverse primer, 5′-CAAAGGCGAAGAGAGGCTGAC-3′; and probe, 5′-FAM (6-carboxyfluorescein)-CCCACCGTGCCCAACCCTTACAACC-TAMRA (6-carboxytetramethylrhodamine). A PureLink Genomic DNA Mini Kit (Invitrogen) was used to isolate DNA from infected and naive PC-3 cells and the concentration of the resulting samples was determined spectrophotometrically. Three independently isolated genomic DNA preparations from each cell line was analyzed and all samples were analyzed in triplicate. Each 40-μl PCR reaction contained 50 ng of genomic DNA, 600 nM of each primer, 200 nM of probe and 1X TaqMan Gene Expression Master Mix (Applied Biosystems). The reactions were carried out in a 7900HT Real-Time PCR System (Applied Biosystems) and the cycling conditions were 10 min at 95°C followed by 40 cycles of 15 sec at 95°C and 1 min at 60°C. Plasmid encoding the corresponding vectors was used to generate a standard curve for absolute quantitation of copy number. Ten-fold serial dilutions of plasmid, containing between 1,500,000 and 15 copies, plus 50 ng of genomic DNA from untransduced cells, were amplified in parallel with the unknown samples. The number of virus copies present in each sample was determined using the standard curve.
Coelenterazine analogs
Clzn-n was obtained from Nanolight Technologies, and clzn-f, clzn-h and ViviRen were obtained from Promega. Stock solutions of clzn, clzn-f and clzn-h were prepared by dissolving the substrates in methanol to a final concentration of 5 mM. ViviRen stock solution was prepared by dissolving the substrate in DMSO to a final concentration of 50 mM. All stock solutions were stored at −80°C until use and aliquots were used only once.
Imaging
Imaging was performed with an IVIS optical imaging system (Xenogen) and the data was processed using Igor Pro (WaveMetrics) and Living Image (Xenogen) image analysis software. Acquisition times were between 1 and 60 seconds, depending on the light intensity of the source. For analysis of live cell cultures or culture supernatant alone, imaging was performed immediately upon addition of substrate to the supernatant. Regions of interest (ROI) were drawn around wells to determine photon flux. For mouse imaging, substrates were administered to the mice either by tail vein (1.7 and 7 nmol/kg doses) or intracardiac (17 nmol/kg doses) injection immediately prior to imaging. For measurement of luminescence from cell implants, ROIs were drawn around the implant region, and for in vivo autoluminescence measurements, ROIs were drawn around the entire mouse. Immediately prior to substrate injections for autoluminescence measurements, background light levels occurring independently of any substrate were determined and the values obtained were subtracted from luminescence readings taken after substrate injection. Signal-to-background ratios in this study are defined as the ratio of luminescence measured from cells transduced with luciferase-encoding vector to that measured from non-transduced cells.
GLuc secretion kinetics determination
To determine the rate of accumulation of GLuc in the media of cultures transduced with AZ3-GLuc, 30,000 cells were plated in the wells of 24-well plates. At 12-hour intervals during the subsequent 72 hours, culture supernatants were harvested from a subset of the wells and stored at −80°C. The cells in these wells were then trypsinized and counted using a hemocytometer for normalization of luminescence readings. After the final harvest, the GLuc activities in the samples were determined by imaging as described above following addition of clzn-n to 15 μM.
Mice
Six- to eight-week-old male athymic nude mice (Charles River Laboratories) were used. The animals were maintained and handled in accordance with institutional guidelines, and all studies were conducted under protocols approved by the UCLA Animal Research Committee. To generate mice bearing luciferase-expressing implants, one million PC-3 cells, transduced with AZ3-RLuc or AZ3-GLuc, were injected subcutaneously into each dorsal flank in a volume of 200 μl containing 50% Matrigel matrix (BD Biosciences). Imaging was performed three days after implantation. Prior to injection of substrate for imaging, mice were anaesthetized by intraperitoneal injection of ketamine (100 mg/kg) and xylazine (10 mg/kg).
Results
Construction and testing of RCR vectors expressing RLuc and GLuc
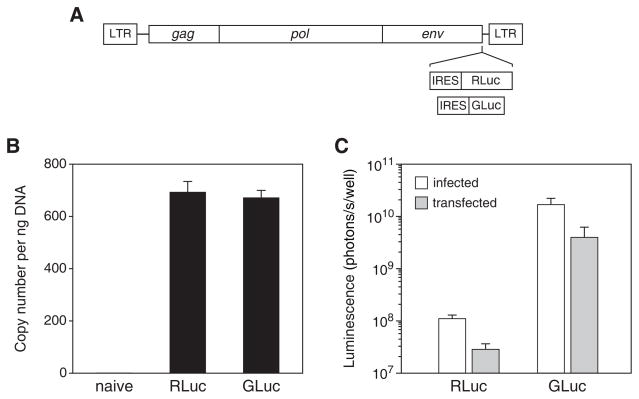
As a model gene delivery system with which to evaluate RLuc and GLuc, we constructed amphotropic murine leukemia virus-based RCR vectors [17, 20] expressing codon-optimized genes encoding RLuc and GLuc (Fig. 1A). We generated cell lines stably transduced with the vectors by infecting, at equal multiplicity of infection, PC-3 human prostate carcinoma cells and allowing the cells to become fully transduced. To determine the numbers of integrated provirus in the two cell lines, we performed quantitative PCR on genomic DNA from these cells using primers specific for the MLV pol gene. The mean copy numbers of vector per ng of DNA was 693 for the cells infected with AZ3-RLuc-infected and 673 for those infected with AZ3-GLuc (Fig. 1B). For normal diploid cells, this corresponds to 4.85 or 4.71 integrations per cell, respectively. This difference was not statistically significant (unpaired t-test, P = 0.259). Addition of clzn-n directly to cultures of these cells or PC-3 cells transiently transfected with the corresponding plasmids produced roughly equivalent relative levels of expression for the two reporters using the two delivery methods (Fig. 1C), further indicating that the stably transduced cells could be used for reliable comparison of the two reporter genes.
Figure 1.
Delivery of RLuc and GLuc genes by a replication-competent retroviral vector. (A) Schematic of RCR vectors AZ3-RLuc and AZ3-GLuc. (B) Determination of vector copy number in cells fully transduced with the vectors after infection at an MOI of 1. A primer-probe set specific for the pol gene was used to measure copy number by real-time PCR. Shown are the mean ± SD obtained from three independently prepared samples of genomic DNA from each cell population. (C) Peak light output attained after the addition of clzn-n to a concentration of 15 μM directly to the supernatant of live cultures either stably infected with the vectors or transiently transfected with the corresponding plasmids. Background luminescence measured after exposure of naïve cultures to the same dose of coelenterazine was subtracted from the readings from the infected or transfected cultures to obtain the luminescence values shown
Luminescence from intracellular versus secreted enzyme
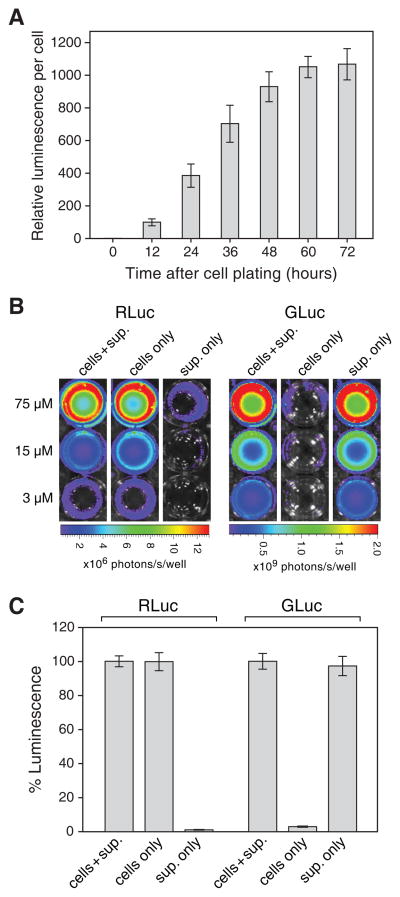
Because GLuc is secreted [6], we wished to determine the kinetics of secretion from cells stably expressing the enzyme. The transduced cells were plated in fresh media and samples of the culture supernatant were taken at 12-hour intervals thereafter and their luciferase activities were measured and normalized for the cell number at the time of harvest (Fig. 2A). Maximal GLuc activity in the supernatant was reached after approximately 60 hours.
Figure 2.
Localization of luciferase activity in live cultures expressing RLuc or GLuc. (A) The secretion kinetics of GLuc were determined by plating PC-3 cells transduced with AZ3-GLuc and measuring luciferase activity in the culture supernatant at 12-h intervals thereafter. At each time point, cell numbers were also determined to normalize luminescence readings. The 0-h time point represents luminescence from fresh, unconditioned media and this value was arbitrarily set to 1. (B) Quantification of cell-associated versus secreted RLuc and GLuc activity. Transduced cells were plated and grown for three days and the following were then imaged to determine luciferase activities upon addition 3, 15 or 75 μM clzn-n: intact cultures containing cells and conditioned supernatant (left columns), cultures whose medium was replaced with medium from untransduced cultures (middle columns), or conditioned medium alone (right columns). Cultures whose medium was replaced were first washed twice with RPMI 1640 to eliminate any residual extracellular luciferase. (C) Luciferase activities from the 15 μM clzn-n doses described in (B) expressed as a percentage of light output from intact cultures. Data are the mean ± SD
We quantitated the contribution of cell-associated versus secreted luciferase to the production of light from the transduced cells. The cells were plated and grown for three days to allow for conditioning of the medium, after which time the cells alone, the supernatant alone, or intact cultures containing both cells and supernatant were assayed for luciferase activity. Figure 2B shows representative imaged plates. RLuc luminescence originated almost entirely (>99%) intracellularly, while approximately 3% of the GLuc signal was from cell-associated enzyme (Fig. 2C) and the remainder from secreted enzyme.
Evaluation of nonspecific and specific light generated with the coelenterazine analogs
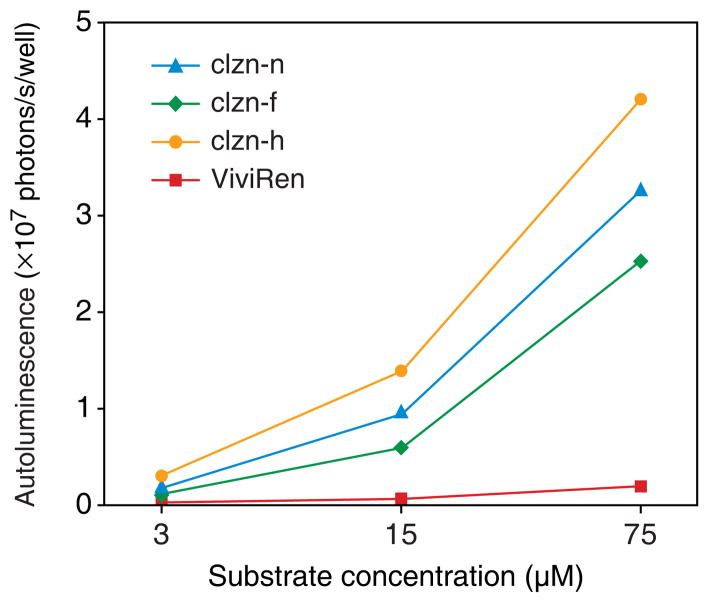
To determine the autoluminescence background generated by the substrates, we measured the light produced upon addition of each substrate directly to the medium of naive cultures to three different concentrations (Fig. 3). While clzn-n, clzn-f and clzn-h produced similar levels of autoluminescence, those of ViviRen were considerably lower, at only 5–10% of the levels of the other three substrates. The relative intensities of autoluminescence from clzn-n, clzn-f and clzn-h are consistent with those previously reported for these substrates in serum-containing cell culture media [14].
Figure 3.
Comparison of the autoluminescence generated by the four substrates in live cultures. Each substrate was added directly to the media of naive PC-3 cultures not expressing any luciferase and the resulting light emission was measured. Light output was determined from the plates every minute for 10 min after the addition of substrate to the indicated concentration. Each value is the mean peak luminescence level reached in four wells
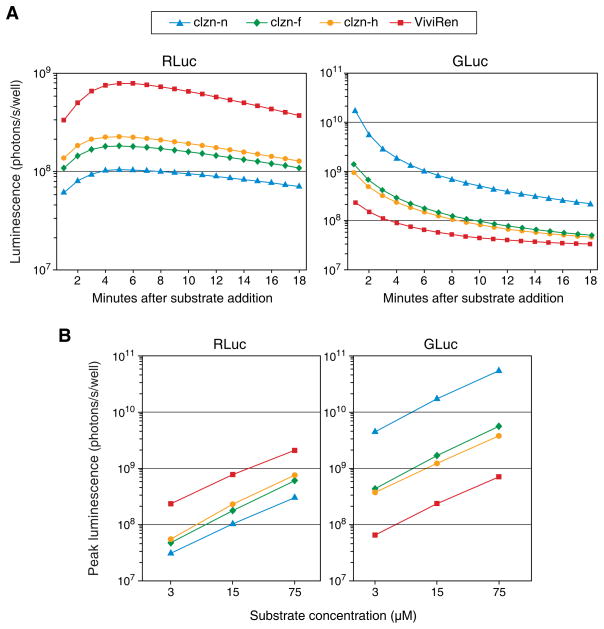
We next determined the kinetics and peak intensity of luciferase-mediated luminescence following the addition of the substrates to cultures of vector-transduced cells. We found that the levels of light generated by each enzyme with the substrates differed greatly, and that the kinetic pattern of luminescence was characteristic of the enzyme (Fig. 4A). With all substrates, luminescence from RLuc peaked at about 5 minutes and decayed slowly thereafter, while luminescence from GLuc peaked within the first 30 seconds and decayed very rapidly. The two enzymes exhibited opposite rank-order peak light output levels with the different substrates, demonstrating the importance of substrate selection with the two reporters. With RLuc, ViviRen produced the strongest signal, and with GLuc, clzn-n produced the strongest signal. Of particular note is that the most commonly used combination among the eight tested, RLuc/clzn-n, generated the least light. Addition of the substrates to three different concentrations, from 3 to 75 μM, revealed a roughly proportional relationship between concentration and peak luminescence for all eight enzyme-substrate pairs (Fig. 4B).
Figure 4.
Kinetics and dose-responsiveness of luminescence from live cultures transduced with AZ3-RLuc or AZ3-GLuc and treated with clzn-n, clzn-h, clzn-f or ViviRen. (A) Time course of light output following addition of substrate to 15 μM. (B) Peak luminescence achieved upon addition of the substrates to three different concentrations. In both (A) and (B), substrate was added directly to the media and luminescence was measured immediately thereafter using the IVIS system. Each point represents the mean signal of three determinations following subtraction of autoluminescence measured from cultures treated with substrate but not expressing any luciferase
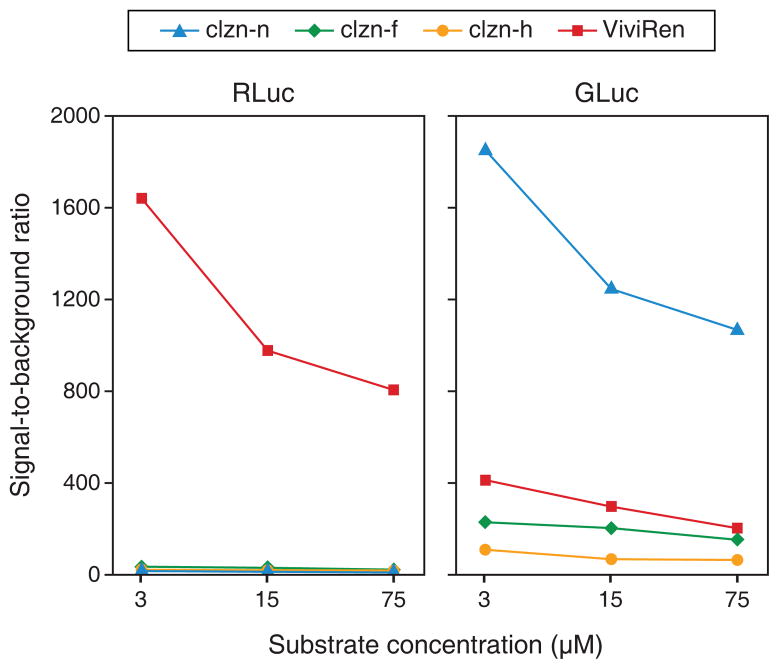
Using the obtained peak autoluminescence (Fig. 3) and enzyme-mediated luminescence (Fig. 4B) values, the signal-to-background ratio for each enzyme-substrate combination at each of the three concentrations tested were determined (Fig. 5). The RLuc/ViviRen and GLuc/clzn-n pairs exhibited by far the most favorable ratios. Again, of all combinations tested, the most commonly used, RLuc/clzn-n, produced the poorest results. Additionally, despite the GLuc/clzn-n pair having generated much higher light output than RLuc/ViviRen, the two pairs possessed similar signal-to-background ratios due to ViviRen’s very low autoluminescence. Because these two pairs exhibited the best results in cell culture, we selected them for further characterization in in vivo BLI.
Figure 5.
Signal-to-background ratios of the eight enzyme–substrate combinations in live cell cultures. Ratios were calculated by dividing the luminescence measured from transduced cultures by the luminescence measured from nontransduced cultures
Comparison of RLuc and GLuc with ViviRen and clzn-n in live animal imaging
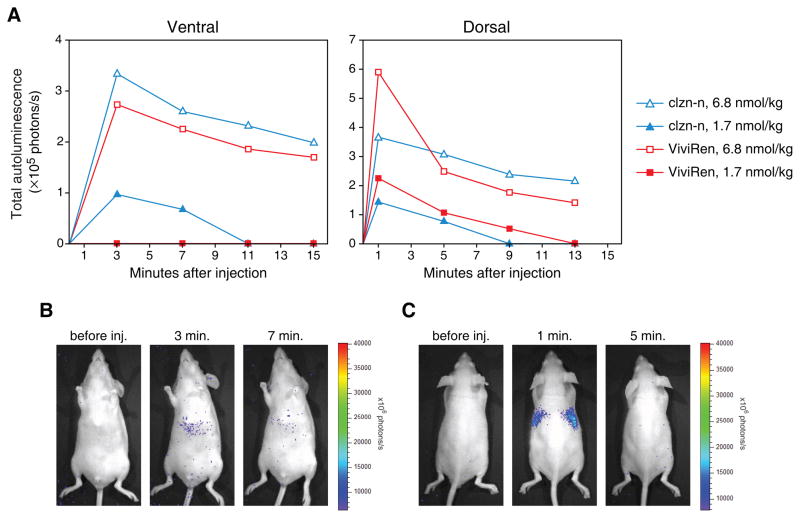
To assess the autoluminescence generated by clzn-n and ViviRen in live animals, we injected naïve mice with two different doses of the substrates and imaged the animals dorsally and ventrally. Surprisingly, the substrates produced similar overall levels of autoluminescence (Fig. 6A), in contrast to the large difference in autoluminescence we observed in cell culture with these compounds. At both doses and at both mouse surfaces, the difference between total autoluminescence was in no case more than 2-fold. We also found that the two substrates produced distinctive patterns of nonspecific light in the mice. Clzn-n generated a slight focus of autoluminescence in the abdominal region, while ViviRen generated more pronounced signals in the thoracic region (Fig. 6B and C). The thoracic signals, which accounted for nearly half of the total autoluminescence at the 1-minute time point and were only seen dorsally, completely disappeared after four minutes.
Figure 6.
Autoluminescence from clzn-n and ViviRen in vivo. Mice were injected intravenously with the indicated doses of clzn-n or ViviRen and imaged ventrally or dorsally every 2 min for the subsequent 15 min. Dorsal and ventral measurements were obtained from the same injections, with either aspect of the mice being imaged at alternating time intervals. (A) Time course of autoluminescence from the entire dorsal or ventral aspect of the mice. Background light levels measured prior to substrate injection were subtracted from the readings taken after injection. Each data point is the average obtained from three injections. (B) Ventral images of a mouse injected with 6.8 nmol/kg of clzn-n, showing characteristic signal from the abdominal region. (C) Dorsal images of a mouse injected with 6.8 nmol/kg of ViviRen showing characteristic thoracic signal at 1 min
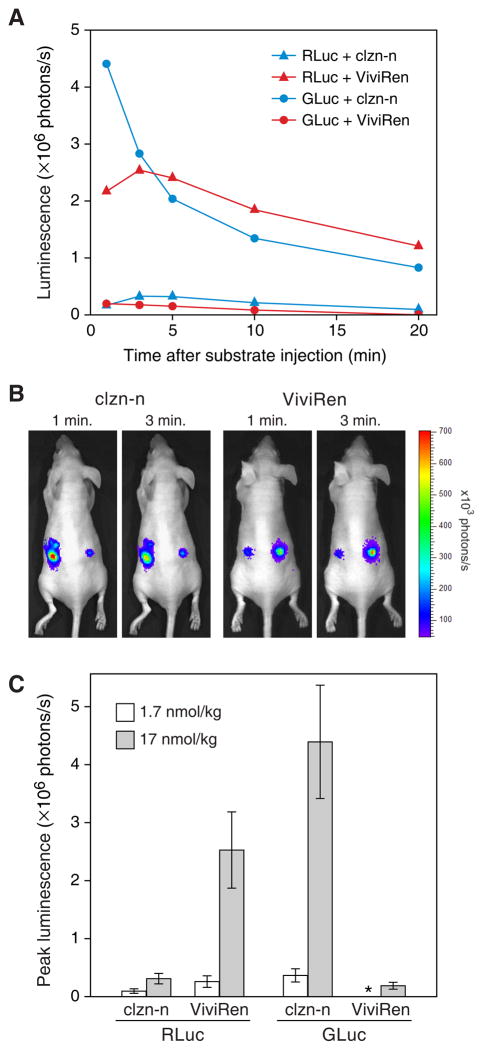
To evaluate the light output from the RLuc/ViviRen and GLuc/clzn-n combinations in live animals, we generated nude mice transiently implanted with the vector-transduced cells. One million of the transduced PC-3 cells were introduced into the subcutaneous flanks of mice, with GLuc-expressing cells on the left and RLuc-expressing cells on the right. The animals were imaged 3 days later to allow time for accumulation of secreted GLuc. Substrate doses of either 1.7 or 17 nmol/kg were injected. It should be noted that the 17 nmol/kg dose is well above that normally required for imaging of subcutaneous tissues expressing RLuc or GLuc. We found that, due to the relatively small number of cells injected, lower doses of substrate produced only weak signals with this model (Fig. 7C and data not shown).
Figure 7.
Light production from RLuc- or GLuc-expressing cells after implantation into nude mice. PC-3 cells, transduced with AZ3-GLuc (left side of mice) or AZ3-RLuc (right side), were injected subcutaneously into the flanks of the mice and imaged 3 days later immediately upon tail vein administration of clzn-n or ViviRen at doses of 1.7 or 17 nmol per kg of body weight. (A) Kinetics of luminescence from the implanted cells after injection of 17 nmol/kg substrate. (B) Representative images obtained at 1 and 3 min after injection of mice with 17 nmol/kg substrate. (C) Average peak luminescence levels from the implants at both doses. The asterisk denotes the absence of luminescence over background from GLuc with 1.7 nmol ViviRen. Error bars, SD
The kinetics of luminescence from each of the four enzyme-substrate pairs in these animals (Fig. 7A) was similar to that observed in cell culture. We noted, however, that the GLuc/clzn-n pair generated substantially lower light levels, relative to all three of the other pairs, in the mice as compared to cell culture. In culture, the relative peak signal intensities for RLuc/clzn-n, RLuc/ViviRen, GLuc/clzn-n and GLuc/ViviRen were roughly 1, 8, 170, and 2 (Fig. 4B), while in the implant-containing mice, they were roughly 1, 8, 15, and 0.7 (Fig. 7C, 17 nmol/kg doses). Thus the GLuc/clzn-n pair, although producing very bright luminescence in mice, generated notably stronger relative signals from the cells in culture than in the animals. Possible explanations for this finding are discussed below.
Discussion
Improvements in methods for localizing and quantitating gene transfer and expression will aid in the development of better vectors for gene therapy [2, 21]. Optical imaging techniques such as BLI have particular promise for this purpose in that they permit the relatively inexpensive, technically straightforward and noninvasive analysis of animals at serial time points [1]. We therefore evaluated four of the most promising coelenterazine-based substrates with cells transduced by vectors expressing RLuc and GLuc to determine which substrates perform best in BLI with these two reporters.
Testing of the eight enzyme-substrate combinations in cell culture revealed striking differences in the ability of the two luciferases to generate light with the substrates. RLuc performed best with ViviRen, while GLuc performed best with the native substrate. Both in vitro and in vivo, these two enzyme-substrate pairs exhibited similar signal-to-background ratios, despite considerable differences in the levels of specific and nonspecific luminescence in cell culture and in mice. In cell culture, ViviRen produced much lower autoluminescence than clzn-n, but in vivo, the difference in autoluminescence from the two substrates was small. The relative intensity of light resulting from GLuc catalysis of clzn-n, however, was also lower in mice than in cell culture, resulting in similar overall detection sensitivities for the RLuc/ViviRen and GLuc/clzn-n pairs in culture and in mice.
Although ViviRen proved to be an excellent substrate for RLuc, it generated relatively weak signals with GLuc. This was presumably due to two factors. First, ViviRen must enter the cell in order to undergo deprotection. Because the vast majority of GLuc is extracellular, the deprotected substrate must then exit the cell to reach the major pool of enzyme. Second, the deprotected form of ViviRen is clzn-h, which itself performed relatively poorly with GLuc. Our findings thus suggest that the development of a non-secreted form of GLuc could permit improved light output with protected substrates such as ViviRen. Efforts to date, however, to create variants of GLuc that are maintained within the cell by removal of the predicted signal peptide sequence have resulted in steep reductions in luciferase activity within cells and in conditioned supernatant ([4] and this study, data not shown).
We found that of the four enzyme-substrate pairs tested in mice, those with GLuc generated markedly lower luminescence in vivo than in vitro relative to those with RLuc. While the relative luminescence of RLuc/clzn-n and RLuc/ViviRen was similar in cell culture and in mice (approximately 1:7 in cell culture and 1:8 in mice), that of GLuc/clzn-n and GLuc/ViviRen were substantially reduced in the animals. Relative to the RLuc/clzn-n and RLuc/ViviRen pairs, they were roughly 12-fold and 4-fold lower, respectively, in mice than in cell culture. These differences with GLuc in cell culture versus in vivo are likely in large part because, in cell culture, secreted GLuc is retained within the culture vessel, whereas in animals, the enzyme is released from the expressing tissue into the bloodstream and undergoes clearance by the kidneys [7]. A recent study indicates maintenance of the association between GLuc and the cells from which is it expressed can be an effective approach to improving the detectability of GLuc by BLI [22].
In summary, our results demonstrate that pairing of GLuc with clzn-n and RLuc with ViviRen allow similar and very high sensitivities for BLI of living cells in culture and mice. Compared to the prototypical RLuc/clzn-n pair, these combinations allow approximately 100–150 times higher signal-to-background ratios in cell culture and 8–15 times higher sensitivity in mice. Our findings should also be of interest to investigators using in vitro reporter gene assays in studies of gene transfer and expression. For such applications requiring very high signal-to-background, the GLuc/clzn-n and RLuc/ViviRen pairs both permit excellent detection sensitivity and have the advantage of being assayable directly from intact cultures.
Acknowledgments
We thank Lily Wu for helpful suggestions and David Stout for assistance with imaging.
This work was supported by NCI grants R01 CA105171 and R01 CA121258 to NK. CL was a UCLA Scholars in Molecular Oncologic Imaging Fellow (NCI grant R25 CA098010). Imaging was performed at the UCLA Crump Institute for Molecular Imaging, which is supported by NCI grants P50 CA086306, 2U24 CA092865, and P30 CA016042.
Footnotes
The authors declare that they have no competing interests that might bias the content of this article.
References
- 1.Iyer M, Sato M, Johnson M, Gambhir SS, Wu L. Applications of molecular imaging in cancer gene therapy. Curr Gene Ther. 2005;5:607–618. doi: 10.2174/156652305774964695. [DOI] [PubMed] [Google Scholar]
- 2.Raty JK, Liimatainen T, Unelma Kaikkonen M, Grohn O, Airenne KJ, Yla-Herttuala S. Non-invasive Imaging in Gene Therapy. Mol Ther. 2007;15:1579–1586. doi: 10.1038/sj.mt.6300233. [DOI] [PubMed] [Google Scholar]
- 3.Barnes AT, Case JF. Bioluminescence in the mesopelagic copepod, Gaussia princeps (T. Scott) J Exp Mar Biol Ecol. 1972;8:53–71. [Google Scholar]
- 4.Tannous BA, Kim DE, Fernandez JL, Weissleder R, Breakefield XO. Codon-optimized Gaussia luciferase cDNA for mammalian gene expression in culture and in vivo. Mol Ther. 2005;11:435–443. doi: 10.1016/j.ymthe.2004.10.016. [DOI] [PubMed] [Google Scholar]
- 5.Lorenz WW, Cormier MJ, O’Kane DJ, Hua D, Escher AA, Szalay AA. Expression of the Renilla reniformis luciferase gene in mammalian cells. J Biolumin Chemilumin. 1996;11:31–37. doi: 10.1002/(SICI)1099-1271(199601)11:1<31::AID-BIO398>3.0.CO;2-M. [DOI] [PubMed] [Google Scholar]
- 6.Szent-Gyorgyi C, Ballou BT, Dagnal E, Bryan B. Cloning and characterization of new bioluminescent proteins. Proceedings of SPIE. 2003;3600:4–11. [Google Scholar]
- 7.Wurdinger T, Badr C, Pike L, et al. A secreted luciferase for ex vivo monitoring of in vivo processes. Nat Methods. 2008;5:171–173. doi: 10.1038/nmeth.1177. [DOI] [PMC free article] [PubMed] [Google Scholar]
- 8.Bhaumik S, Gambhir SS. Optical imaging of Renilla luciferase reporter gene expression in living mice. Proc Natl Acad Sci U S A. 2002;99:377–382. doi: 10.1073/pnas.012611099. [DOI] [PMC free article] [PubMed] [Google Scholar]
- 9.Zhao H, Doyle TC, Coquoz O, Kalish F, Rice BW, Contag CH. Emission spectra of bioluminescent reporters and interaction with mammalian tissue determine the sensitivity of detection in vivo. J Biomed Opt. 2005;10:41210. doi: 10.1117/1.2032388. [DOI] [PubMed] [Google Scholar]
- 10.Loening AM, Fenn TD, Wu AM, Gambhir SS. Consensus guided mutagenesis of Renilla luciferase yields enhanced stability and light output. Protein Eng Des Sel. 2006;19:391–400. doi: 10.1093/protein/gzl023. [DOI] [PubMed] [Google Scholar]
- 11.Loening AM, Wu AM, Gambhir SS. Red-shifted Renilla reniformis luciferase variants for imaging in living subjects. Nat Methods. 2007;4:641–643. doi: 10.1038/nmeth1070. [DOI] [PubMed] [Google Scholar]
- 12.Hart RC, Matthews JC, Hori K, Cormier MJ. Renilla reniformis bioluminescence: luciferase-catalyzed production of nonradiating excited states from luciferin analogues and elucidation of the excited state species involved in energy transfer to Renilla green fluorescent protein. Biochemistry. 1979;18:2204–2210. doi: 10.1021/bi00578a011. [DOI] [PubMed] [Google Scholar]
- 13.Inouye S, Shimomura O. The use of Renilla luciferase, Oplophorus luciferase, and apoaequorin as bioluminescent reporter protein in the presence of coelenterazine analogues as substrate. Biochemical and biophysical research communications. 1997;233:349–353. doi: 10.1006/bbrc.1997.6452. [DOI] [PubMed] [Google Scholar]
- 14.Zhao H, Doyle TC, Wong RJ, et al. Characterization of coelenterazine analogs for measurements of Renilla luciferase activity in live cells and living animals. Mol Imaging. 2004;3:43–54. doi: 10.1162/15353500200403181. [DOI] [PubMed] [Google Scholar]
- 15.Hawkins E, Unch J, Murphy N, et al. Measuring Renilla Luciferase Luminescence in Living Cells. Promega Notes. 2005;90:10–14. [Google Scholar]
- 16.Otto-Duessel M, Khankaldyyan V, Gonzalez-Gomez I, Jensen MC, Laug WE, Rosol M. In vivo testing of Renilla luciferase substrate analogs in an orthotopic murine model of human glioblastoma. Mol Imaging. 2006;5:57–64. [PubMed] [Google Scholar]
- 17.Logg CR, Logg A, Tai CK, Cannon PM, Kasahara N. Genomic stability of murine leukemia viruses containing insertions at the Env-3′ untranslated region boundary. J Virol. 2001;75:6989–6998. doi: 10.1128/JVI.75.15.6989-6998.2001. [DOI] [PMC free article] [PubMed] [Google Scholar]
- 18.Logg CR, Kasahara N. Retrovirus-mediated gene transfer to tumors: utilizing the replicative power of viruses to achieve highly efficient tumor transduction in vivo. Methods Mol Biol. 2004;246:499–525. doi: 10.1385/1-59259-650-9:499. [DOI] [PubMed] [Google Scholar]
- 19.Baranick BT, Lemp NA, Nagashima J, Hiraoka K, Kasahara N, Logg CR. Splicing mediates the activity of four putative cellular internal ribosome entry sites. Proc Natl Acad Sci U S A. 2008;105:4733–4738. doi: 10.1073/pnas.0710650105. [DOI] [PMC free article] [PubMed] [Google Scholar]
- 20.Logg CR, Tai CK, Logg A, Anderson WF, Kasahara N. A uniquely stable replication-competent retrovirus vector achieves efficient gene delivery in vitro and in solid tumors. Hum Gene Ther. 2001;12:921–932. doi: 10.1089/104303401750195881. [DOI] [PMC free article] [PubMed] [Google Scholar]
- 21.Waehler R, Russell SJ, Curiel DT. Engineering targeted viral vectors for gene therapy. Nat Rev Genet. 2007;8:573–587. doi: 10.1038/nrg2141. [DOI] [PMC free article] [PubMed] [Google Scholar]
- 22.Santos EB, Yeh R, Lee J, et al. Sensitive in vivo imaging of T cells using a membrane-bound Gaussia princeps luciferase. Nat Med. 2009;15:338–344. doi: 10.1038/nm.1930. DOI: nm.1930 [pii] 10.1038/nm.1930. [DOI] [PMC free article] [PubMed] [Google Scholar]


