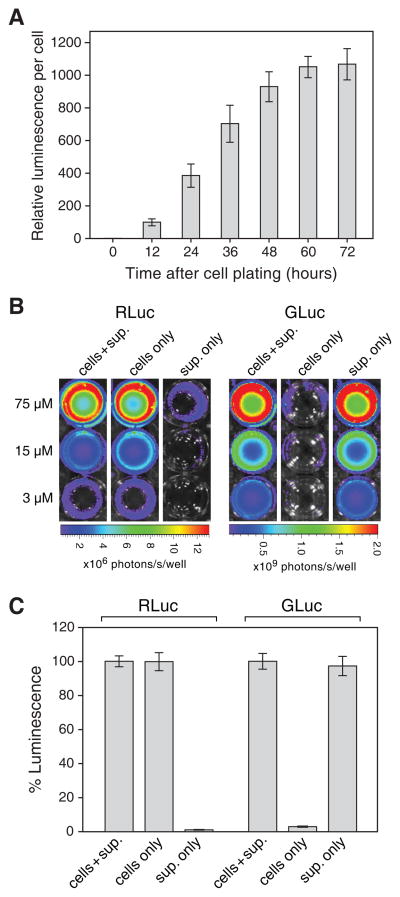
Figure 2.
Localization of luciferase activity in live cultures expressing RLuc or GLuc. (A) The secretion kinetics of GLuc were determined by plating PC-3 cells transduced with AZ3-GLuc and measuring luciferase activity in the culture supernatant at 12-h intervals thereafter. At each time point, cell numbers were also determined to normalize luminescence readings. The 0-h time point represents luminescence from fresh, unconditioned media and this value was arbitrarily set to 1. (B) Quantification of cell-associated versus secreted RLuc and GLuc activity. Transduced cells were plated and grown for three days and the following were then imaged to determine luciferase activities upon addition 3, 15 or 75 μM clzn-n: intact cultures containing cells and conditioned supernatant (left columns), cultures whose medium was replaced with medium from untransduced cultures (middle columns), or conditioned medium alone (right columns). Cultures whose medium was replaced were first washed twice with RPMI 1640 to eliminate any residual extracellular luciferase. (C) Luciferase activities from the 15 μM clzn-n doses described in (B) expressed as a percentage of light output from intact cultures. Data are the mean ± SD

