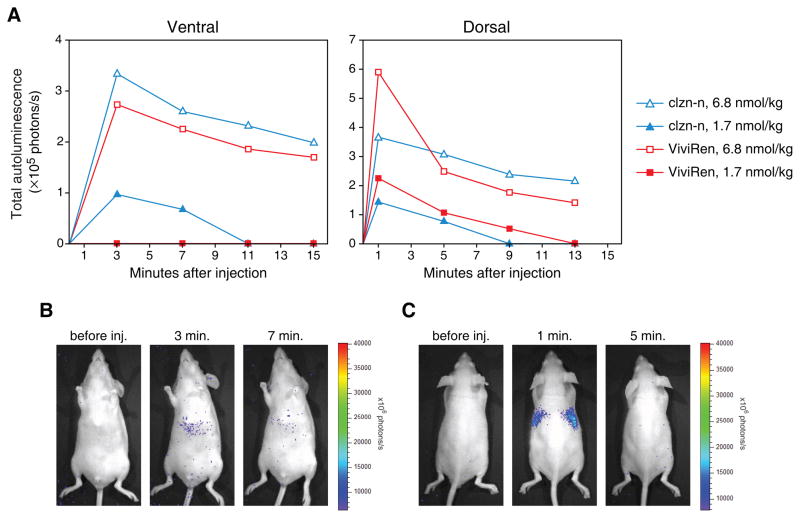
Figure 6.
Autoluminescence from clzn-n and ViviRen in vivo. Mice were injected intravenously with the indicated doses of clzn-n or ViviRen and imaged ventrally or dorsally every 2 min for the subsequent 15 min. Dorsal and ventral measurements were obtained from the same injections, with either aspect of the mice being imaged at alternating time intervals. (A) Time course of autoluminescence from the entire dorsal or ventral aspect of the mice. Background light levels measured prior to substrate injection were subtracted from the readings taken after injection. Each data point is the average obtained from three injections. (B) Ventral images of a mouse injected with 6.8 nmol/kg of clzn-n, showing characteristic signal from the abdominal region. (C) Dorsal images of a mouse injected with 6.8 nmol/kg of ViviRen showing characteristic thoracic signal at 1 min

