Figure 7.
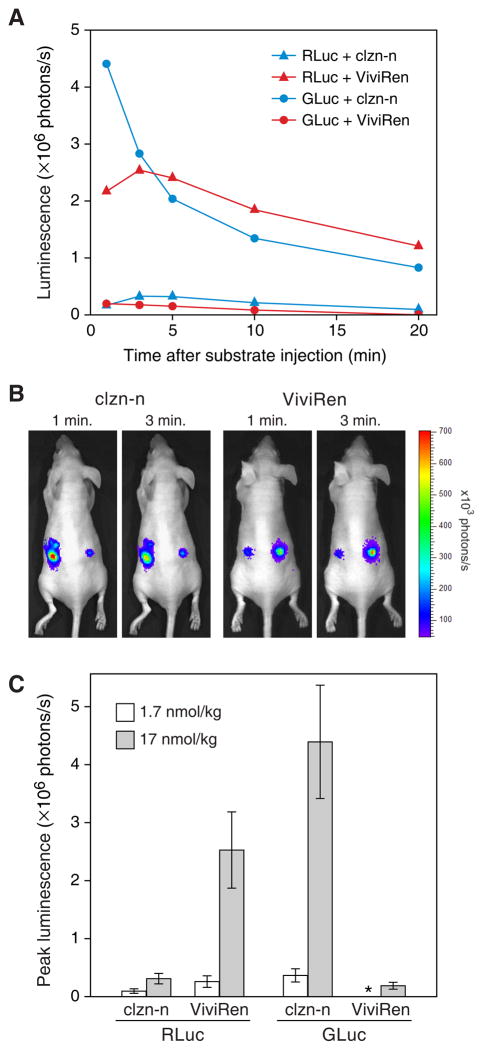
Light production from RLuc- or GLuc-expressing cells after implantation into nude mice. PC-3 cells, transduced with AZ3-GLuc (left side of mice) or AZ3-RLuc (right side), were injected subcutaneously into the flanks of the mice and imaged 3 days later immediately upon tail vein administration of clzn-n or ViviRen at doses of 1.7 or 17 nmol per kg of body weight. (A) Kinetics of luminescence from the implanted cells after injection of 17 nmol/kg substrate. (B) Representative images obtained at 1 and 3 min after injection of mice with 17 nmol/kg substrate. (C) Average peak luminescence levels from the implants at both doses. The asterisk denotes the absence of luminescence over background from GLuc with 1.7 nmol ViviRen. Error bars, SD

