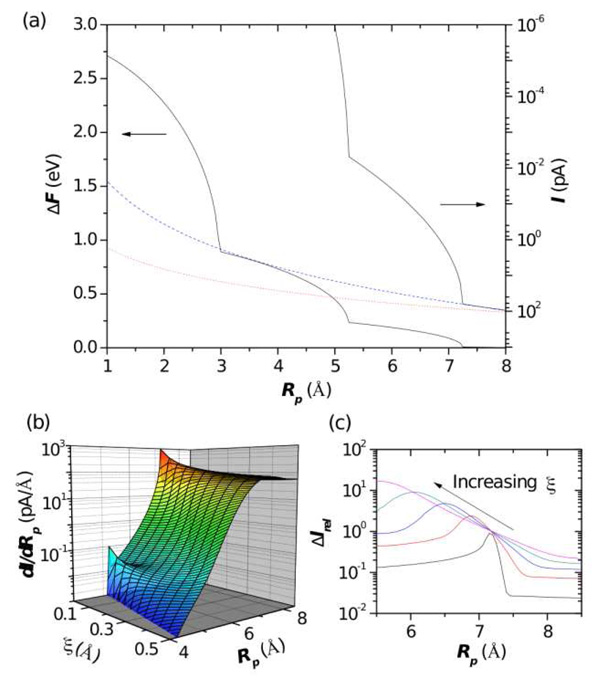
Figure 3.
(a) Free energy barrier to bring an ion into a nanopore and the ionic current at room temperature as a function of the effective pore radius. The dotted red line indicates the ionic current without a free energy barrier and the dashed blue line is the current with just the entropic barrier. The current is calculated at 120 mV and 1 M bulk salt concentration assuming the ionic current is given by , where the density n is proportional to a Boltzmann factor containing the energy barrier, namely n = n0 exp(−ΔF/kT), with n0 the bulk salt concentration, μ the ion mobility, and E the strength of the electric field. A typical ion mobility is μ = 2.28 × 10⁻⁸m2/Vs (see, e.g., Refs. [27] and [28]). (b) dI/dRp as a function of pore radius and noise strength. For zero noise, the step-like features in the ionic current give rise to well defined peaks in the derivative of the current. However, as the noise is increased, the peaks smooth out. This occurs beyond a noise strength of ξ = 0.2 – 0.3 Å for the second and third layers (see text for details). (c) Relative noise, ΔIrel = (〈I2〉 − 〈I〉2)1/2/〈I〉, versus pore radius for the outermost hydration layer and for ξ = 0.05, 0.15, 0.25, 0.35, 0.45. If the pore radius is tuned to the radius of a hydration layer, fluctuations give rise to a peak in the relative noise, which gives an alternative method to observe the effect of the hydration layer.

