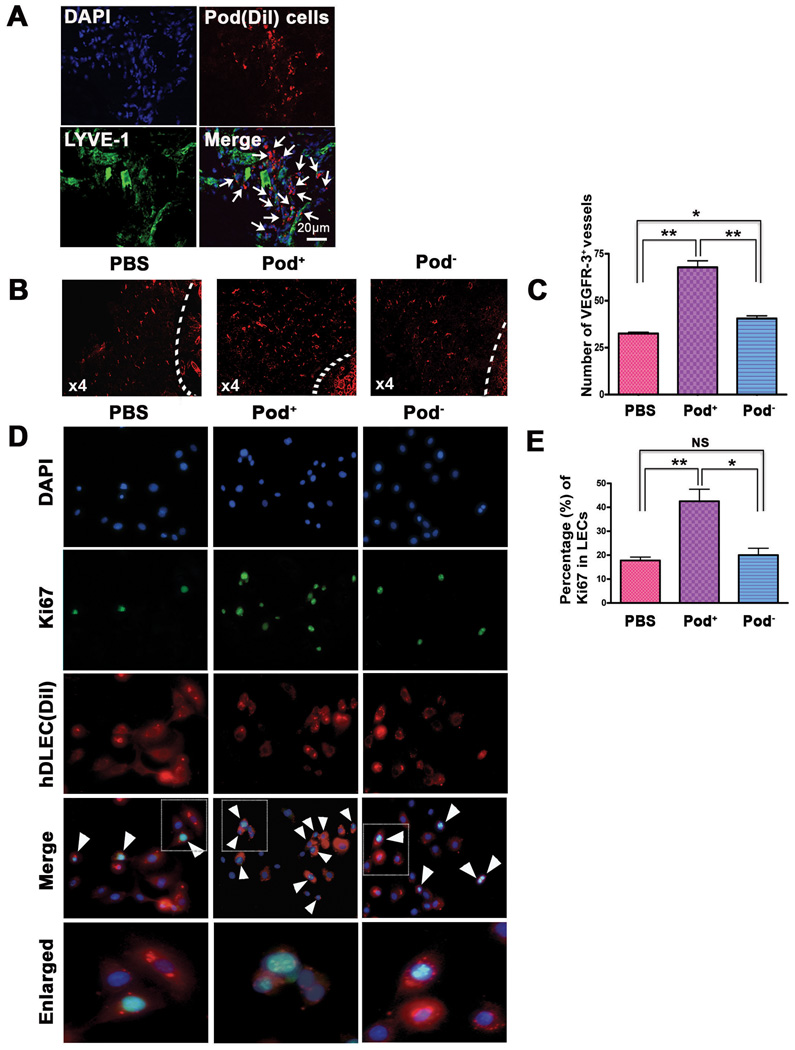
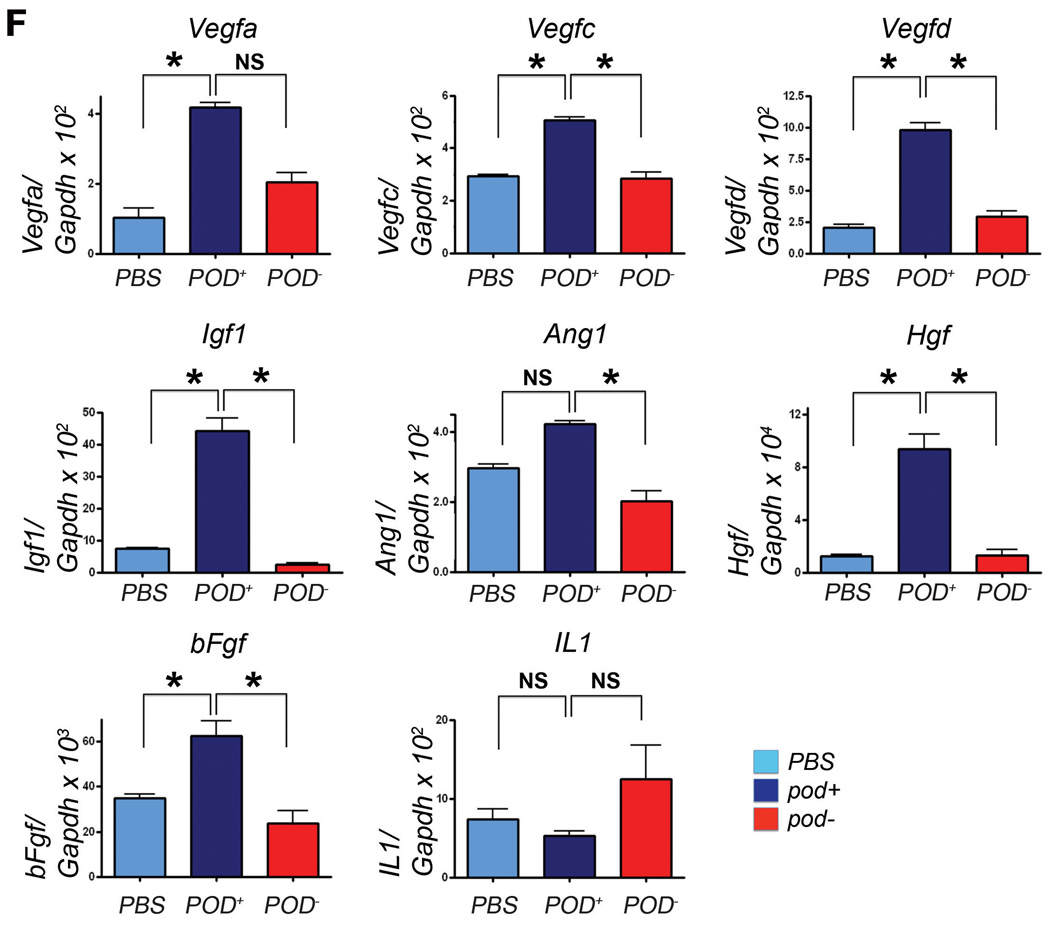
Figure 4. Lymphangiogenic characteristics of pod+ cells.
A, Pod+ cells sorted from 4-day cultured BM-MNCs labeled with Dil were injected into the periphery of tumors in mice that had been injected with melanoma cells 7 days before. Seven days after cell implantation, tumor and peritumoral tissues including skin were harvested and underwent immunostaining for LYVE-1 (green). The arrows indicate engraftment of pod+ cells in close proximity to lymphatic vessels. Representative images from more than two independent experiments are shown (n = 3 per experiment). DAPI (blue). Scale bar = 20 µm. B, The peritumoral tissues which were injected with pod+ cells, pod− cells or the same volume of PBS similarly to the procedure described above were harvested 7 days later and subjected to immunohistochemistry using a VEGFR-3 antibody. Representative images from at least two independent experiments are shown (n = 2 per group). Magnification, × 4. C, The number of VEGFR-3+ vessels in peritumoral tissues was higher in mice implanted with pod+ cells than pod− cells or PBS. The indicated values were calculated from two independent experiments (B) using more than 10 randomly selected fields (** P<0.01, * P<0.05). D, The pod+- and pod− cells from 4 day-cultured BM-MNCs or PBS were mixed with Dil-labeled hDLECs (red), cultured for 24 hrs and stained for Ki67 (green). DAPI (blue). The cells positive for Dil, Ki67 and DAPI (white arrowheads) were counted. Representative images from three independent experiments are shown. Scale bar = 20 µm. E, hDLECs cocultured with pod+ cells exhibited a higher rate of Ki67+ cells compared to controls, suggesting a lymphangiogenic role of pod+ cells on surrounding LECs. The indicated values are the averages calculated from 14 randomly selected fields of each group of three independent experiments. (** P<0.01, * P<0.05). F, Tissues from mice injected with pod+ or pod− cells were subjected to qRT-PCR analyses. Graphs from three independent experiments are shown (* P<0.05, n=3 per group).


