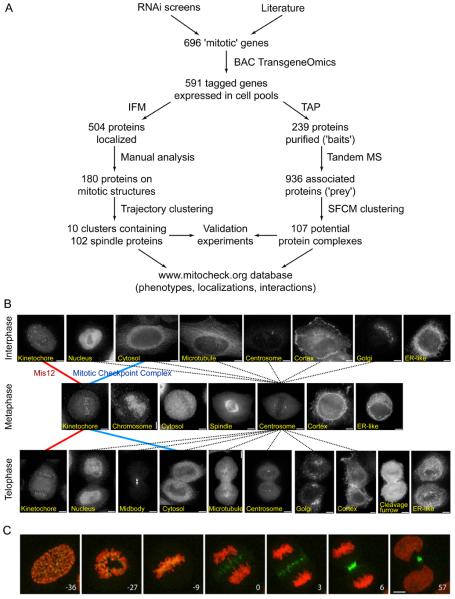
Fig. 1.
Use of BAC TransgeneOmics for identification and characterization of mitotic protein complexes in human cells.
(A) Schematic outline of the workflow established for BAC tagging, GFP localization and tandem affinity purification (TAP)-mass spectrometry (MS) of mitotic proteins. IFM, immunofluorescence microscopy.
(B) Representative images of fixed HeLa cells, obtained by immunofluorescence microscopy with antibodies to GFP. Examples of cells are shown that stably express LAP-tagged proteins that have different locations in interphase, metaphase or telophase, as indicated in the images. Images are connected by lines that represent a subset of the localization trajectories observed for different proteins. The red and blue lines represent the trajectories of MIS12 and MCC, respectively. Dotted lines represent all observed trajectories that include centrosome localization in metaphase. Size bar, 10 μm.
(C) Time-lapse images of a mitotic HeLa cell stably expressing H2B-mCherry (red) and the CPC subunit INCENP-LAP (green). Numbers indicate time (minutes) before and after anaphase onset. Size bar, 10 μm.

