Fig. 5.
Characterization of the γ-TuRC interacting proteins MOZART1 and MOZART2B.
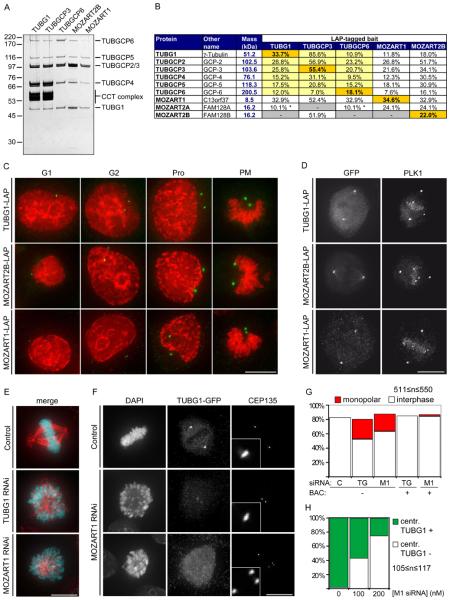
(A) Silver-stained SDS-PAGE gel of LAP-purified TUBG1, TUBGCP3, TUBGCP6, MOZART2B and MOZART1. Numbers on the left indicate the molecular masses of reference proteins. Proteins annotated based on expected electrophoretic mobility are listed on the right. CCT, chaperonin containing T-complex.
(B) Mass spectrometry results obtained from the samples in (A), showing identification of γ-TuRC subunits plus MOZART1, MOZART2A and MOZART2B. Entries highlighted in orange are bait proteins, yellow indicates proteins whose interaction with the bait has previously been reported, a white background indicates that the interaction was previously unknown. Asterisks indicate proteins identified by a single unique peptide.
(C) Immunofluorescence microscopy images showing centrosomal localization of TUBG1, MOZART2B and MOZART1 through the cell cycle (G1-phase, G2-phase, prophase (Pro) or prometaphase (PM)). HeLa cells expressing the indicated proteins were fixed and stained with antibodies to GFP (green) and with DAPI (red).
(D) Immunofluorescence microscopy images showing localization of TUBG1, MOZART2B and MOZART1 to centrosomes and the mitotic spindle in metaphase in fixed LAP-cells stained with antibodies to GFP and PLK1. All images in this figure are maximum-intensity projections of DeltaVision stacks. Size bar, 10 μm.
(E) Immunofluorescence microscopy images of HeLa cells treated for 72 hr with 100 nM siRNA specific to either TUBG1 or MOZART1. Cells were fixed and stained with DAPI (cyan) and TUBA1A antibodies (red). Size bar, 10 μm.
(F) Immunofluorescence microscopy images of TUBG1-LAP HeLa cells treated for 72 hr with 100 nM siRNA against TUBG1 to deplete the endogenous TUBG1 and, simultaneously, transfected either with luciferase siRNA (control siRNA) or MOZART1 siRNA. Cells were fixed and stained with DAPI, GFP antibodies (to visualize TUBG1-LAP) and CEP135 (to stain centrioles). Two distinct phenotypes were observed: CEP135 foci in close proximity to each other that colocalize with faint TUBG1-GFP foci (middle row) and CEP135 foci dispersed randomly dispersed throughout the cell with no detectable TUBG1-GFP foci (bottom row). Insets in the third column are magnified five-fold to show one centrosome. Size bar, 10 μm.
(G) Histogram showing quantification of the experiment described in (E). In addition, cells containing the mouse TUBG1-LAP or the mouse MOZART1-LAP (BAC +) were treated with 100 nM siRNA specific for TUBG1 or MOZART1, respectively, and fixed and stained as in E. C, control, TG, TUBG1 siRNA, M1, MOZART1 siRNA.
(H) Histogram showing quantification of the experiment described in (F). The number of cells with GFP positive (TUBG1 +) or negative (TUBG1 −) centrosomes was counted. The GFP-negative cells are a combination of both MOZART1-depletion phenotypes shown in (F).

