
Figure 6.
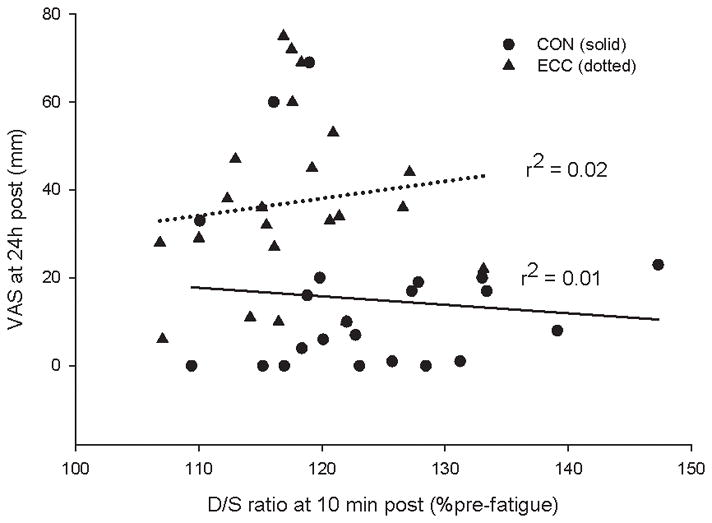
A scatter plot showing the relationship between the D/S ratio measured 10 min post fatigue and the VAS score taken 24 h post fatigue in both CON and ECC exercise protocols. The best-fit lines with their r2 values are presented for the two protocols.