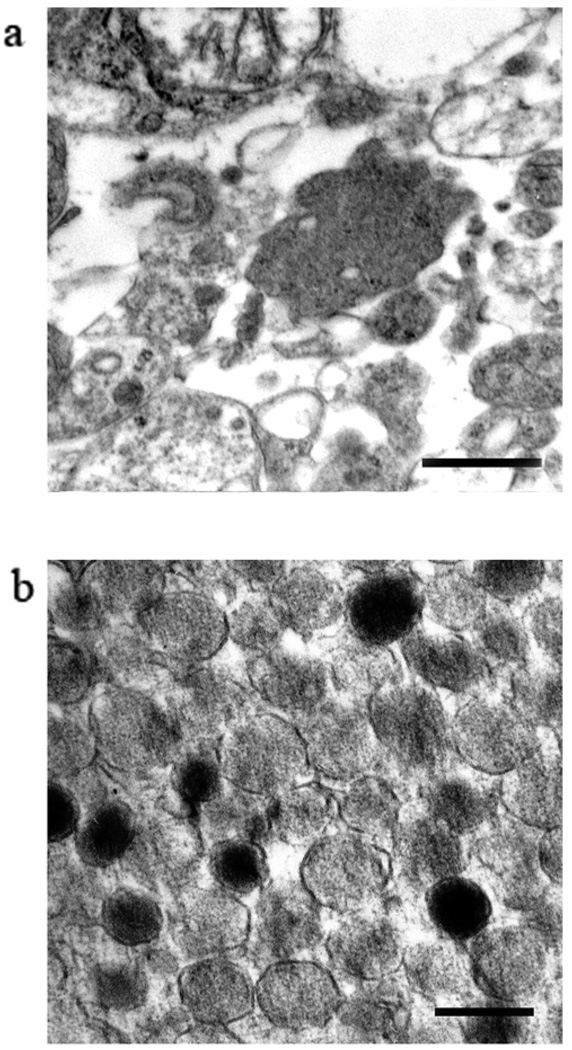
Figure 3. Secretory granules visualized by electron microscopy.
(a) A representative cut of the total cell extract; bar: 500 nm. (b) A representative cut thought the purified secretory granules pellet shows a population of intact, membrane bound granules, homogeneous is size. Most of them are slightly decondensed (see text); bar: 200 nm.

