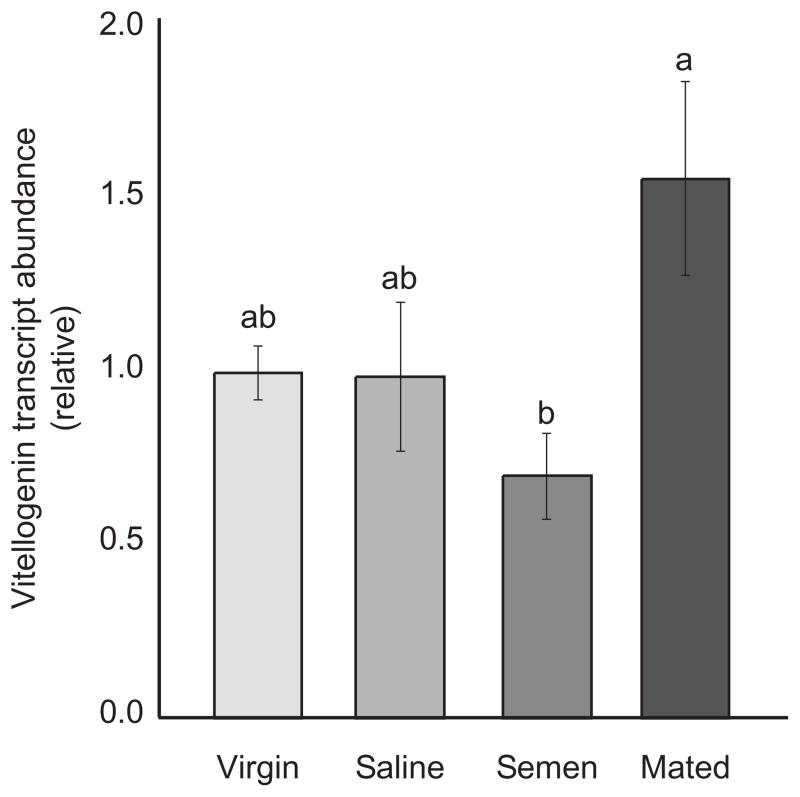
Figure 2. Abdominal Vitellogenin transcript abundance.
Using quantitative, real-time PCR (n=6, each group), we identified significant variation in abdominal transcript abundance of Vg mRNA (ANOVA, p=0.04, Tukey LSD). Mated queens had the highest level of Vg transcripts, while semen-inseminated queens had the lowest level. Virgin and saline-inseminated queens were intermediate. Error bars represent the standard error.

