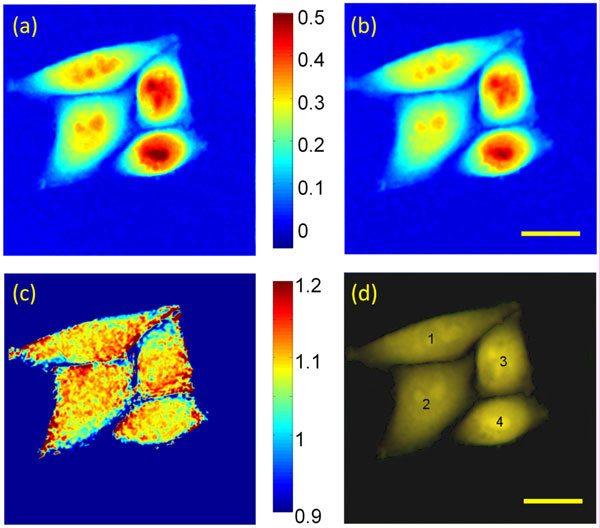
Fig. 3.

Optical path length image of HeLa cells at (a) 310 nm and (b) 400 nm; (c) ratio image of magnification corrected OPL images at 310 nm and 400 nm; (d) composite image of corrected OPL images using red and green channels for 310 nm and 400 nm images, respectively. The number indicates the auto-segmented cell number and the gray dashed line depicts the borders of each cell. Scale bar: 20 μm.
