Fig. 4.

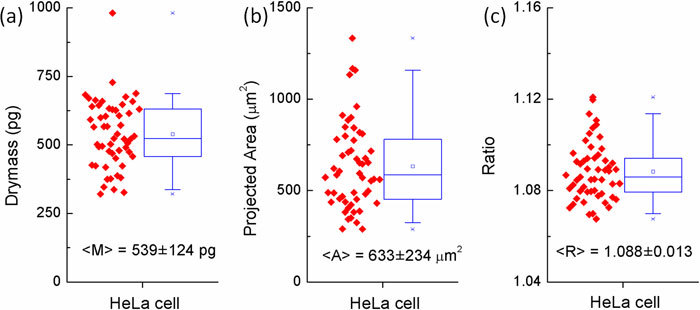
Scatter and box plots of the (a) dry mass (b) projected area (c) dispersion of 54 HeLa cells. The box indicates 25%-75% range and whiskers indicates 5%-95% range.

Scatter and box plots of the (a) dry mass (b) projected area (c) dispersion of 54 HeLa cells. The box indicates 25%-75% range and whiskers indicates 5%-95% range.