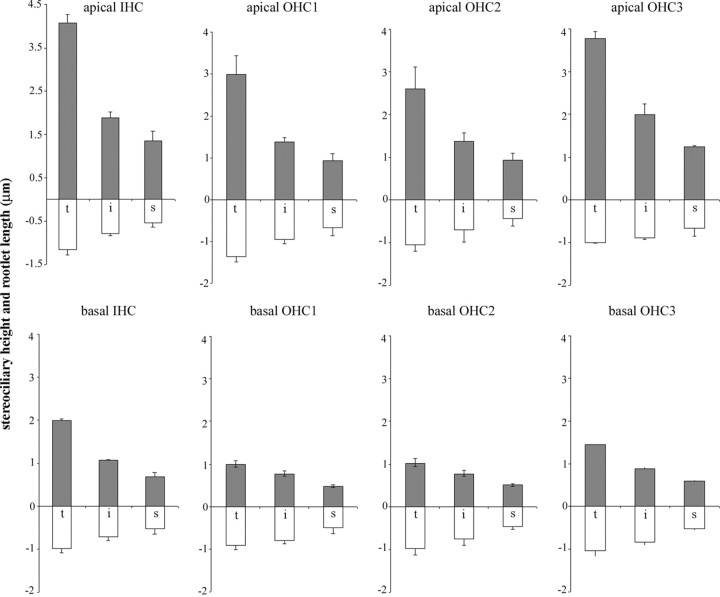
Figure 5.
Histogram showing the mean lengths of stereocilia and cuticular portion of the rootlets from apical and basal hair cells from rat cochlea. Means and SEMs are given for each row of stereocilia from each row of OHCs and are based on all of the stereocilia and rootlets measured for the present study in three animals. Comparison of apical and basal hair cells shows that although the stereocilia are substantially shorter in the basal regions compared with their apical counterparts, the rootlets change to a much lesser degree. Data for IHCs derived from one animal are shown for comparison and reveal a similar pattern. t, Tall; i, intermediate; s, short; gray upward bars are the stereocilia; white downward bars are the rootlets.

