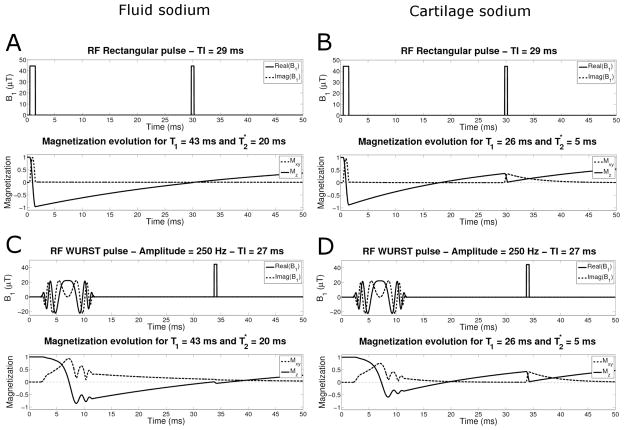
Fig. 1.
RF pulse sequence and sodium magnetization evolution during the IR sequence. A and C: Fluid sodium (T1 = 43 ms and ) with the rectangular pulse (with TI = 29 ms) and WURST pulse (with TI = 27) respectively. B and D: Cartilage sodium short component (T1 = 26 ms and ) with the rectangular pulse and WURST pulse respectively, and the same TI as for fluid sodium.

