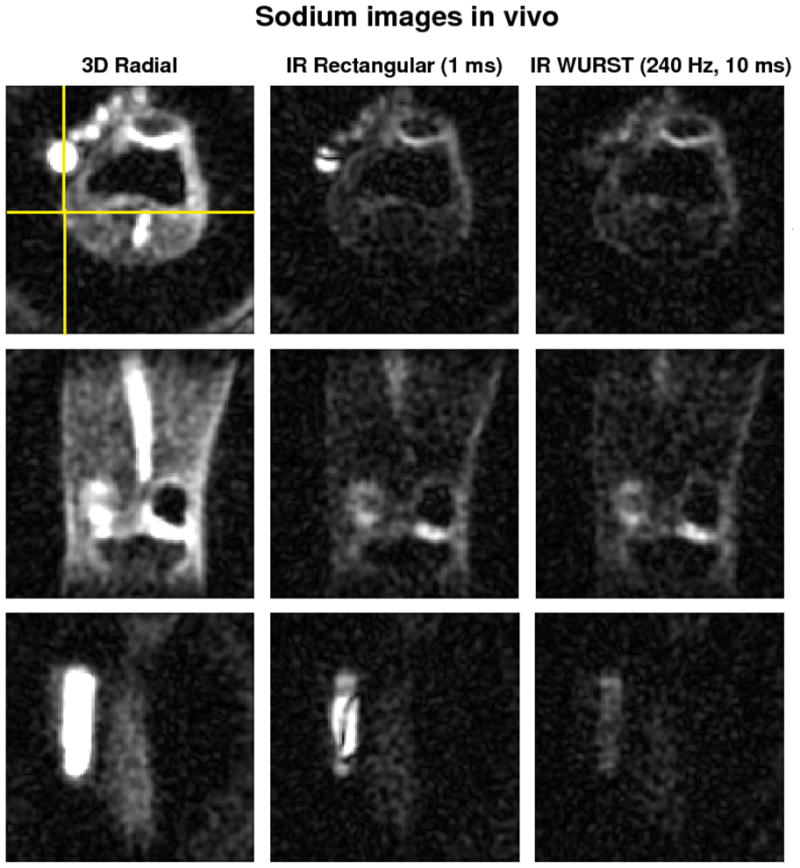
Fig. 6.

Transverse (top row), coronal (middle row) and sagittal (bottom row) sodium images of the knee joint of a volunteer at 7T. The total acquisition time of the 3D radial sequence without inversion and IR with rectangular pulse was 16:50 min. The WURST inversion pulse had an amplitude of 240 Hz and duration 10 ms, but due to SAR limitations, the TR was extended to 145 ms, leading to a total time of acquisition of the adiabatic IR sequence of 24:30 min. The images are averaged over 2 slices for better visualization. The same range scaling is applied to all the images. The coronal slice is represented by the horizontal yellow line drawn on the transverse image. The sagittal slice was chosen to pass through the PBS tube in order to show the strong suppression inhomogeneities of the rectangular inversion pulse (vertical yellow line). Note the uniform and complete fluid suppression with the WURST inversion pulse in the PBS tube and the very non-uniform fluid attenuation obtained with the rectangular pulse.
