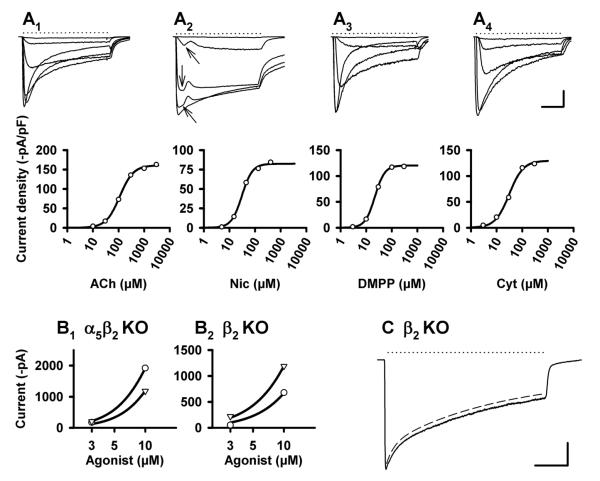
Figure 6. Functional properties of α3β4 nAChRs (in α5β2 KO mice).
A. Agonist-induced currents (upper panels; applications indicated by dotted lines), and corresponding concentration-response curves (lower panels) by the nAChR agonists ACh (A1, in the presence of 0.1 μM atropine), nicotine (A2), DMPP (A3), and cytisine (A4). Arrows in A2 indicate an initial “hump” discussed in the Results section. In order to construct the dose-response curves, peak current amplitudes were fitted to the logistic equation shown in Methods. Averaged fit parameters are provided in Table 1. Calibration A1-A4: 500 msec; 2 nA.
B. Potency ratios determined from agonist-induced peak currents elicited at the low end of the concentration-response curves. B1. α5β2 KO: Peak current amplitudes in response to 3 and 10 μM DMPP (circles) and cytisine (triangles), respectively, were fitted to the logistic equation with the constraints of a common slope and a maximum set to 7 nA. This resulted in fictitious EC50 values of 16.1 μM (DMPP) and 21.7 μM (cytisine) and a potency ration of 21.7/16.1 = 1.34. B2. β2 KO: Same protocol as described for panel B1. Fictitious EC50 values were 39.2 μM (DMPP) and 26.2 μM (cytisine), with a resulting potency ration of 0.67. Note that cytisine is more potent than DMPP in the β2 KO, whereas potencies are reversed in the α5β2 double KO. Averaged potency ratios from identically designed experiments are provided in Fig. 7.
C. Patch clamp recording of a SCG neuron taken from a β2 KO mouse, with current induced by 300 μM ACh in the presence of 0.1 μM atropine (dotted line). Dashed line indicates decay of current fitted to the sum of two exponential functions (displaced for clarity from original trace by 200 pA). Fit parameters are 0.47 sec (Tf, fast), 6.98 sec (Ts, slow), −809 pA (Af, fast), −2899 pA (As, slow), −943 pA (plateau). Calibration: 2 sec, 1 nA. Averaged fit parameters from identically designed experiments are provided in Table 2.

