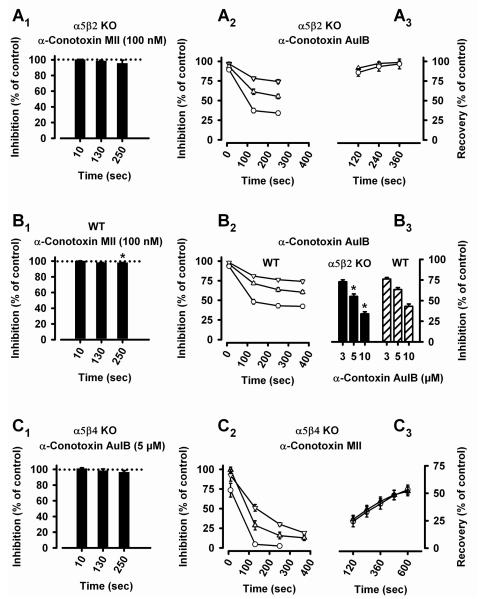
Figure 8. Effects of the α-conotoxins AuIB and MII.
Currents were induced by 300 μM ACh (in the presence of 0.1 μM atropine, 0.5 μM TTX, and 0.1 mg/ml bovine serum albumin) in cultured SCG neurons of α5β2 KO (A1-A3, B3), WT (B1-B3), or α5β4 KO (C1-C3) mice, and in the absence (control, 100 %) or presence of the α-conotoxins AuIB or MII.
A1. α5β2 KO mice: Bars (mean percentage of currents relative to controls ± SEM, n = 7-9 cells) show the absence of effects of α-conotoxin MII on nAChRs in SCG neurons of α5β2 KO mice. The application of 100 nM α-conotoxin MII for indicated periods of time does not significantly decrease peak currents (one sample Student’s t-test with reference to a hypothetical 100 %: P10 sec = 0.6752; P130 sec = 0.2009; P250 sec = 0.3046). A2. Time- and concentration-dependent inhibition by α-conotoxin AuIB of nAChRs remaining in SCG neurons of α5β2 KO mice. Triangles down: 3 μM (n = 5 cells); triangles up: 5 μM (n = 8 cells); circles: 10 μM α-conotoxin AuIB (n = 7 cells). Data points are the mean percentages of currents relative to controls ± SEM (shown if error bars exceed symbols). A3. Fast and full recovery of the inhibition by 5 μM (triangles down, n = 3 cells) and 10 μM α-conotoxin AuIB (circles, n = 4 cells).
B1. WT mice: Bars (mean percentage of currents relative to controls ± SEM, n = 13 cells) show little effect of α-conotoxin MII on nAChRs in SCG neurons of WT mice. The application of 100 nM α- conotoxin MII for indicated periods of time leaves 100.4 % (after 10 sec, P = 0.6119), 98.4 % (after 130 sec, P = 0.0534), and 98.2 % (after 250 sec, P = 0.0498) of control peak currents (one sample Student’s t-test with reference to a hypothetical 100 %). B2. Time- and concentration-dependent inhibition by α-conotoxin AuIB of nAChRs in SCG neurons of WT mice. Triangles down: 3 μM (n = 8-11 cells); triangles up: 5 μM (n = 13-14 cells); circles: 10 μM α-conotoxin AuIB (n = 8 cells). Data points are the mean percentages of currents relative to controls ± SEM (shown if error bars exceed symbols). B3. Concentration-dependent inhibition by indicated concentrations of conotoxin AuIB of nAChR currents in SCG neurons of α5β2 KO (filled bars) or WT (hatched bars) mice. Currents induced by 300 μM ACh were measured 250 sec after toxin application and set in relation to control peak currents. AuIB has a significantly larger effect in α5β2 KO than in WT mice (AuIB at 5 μM: α5β2 KO: 55.2 ± 2.9 %, n = 8 cells; WT: 63 ± 2.4 %, n = 14 cells; P = 0.0483, Student’s t-test; AuIB at 10 μM: α5β2 KO: 34.0 ± 2.5 %, n = 7 cells; WT: 43.0 ± 3.0 %, n = 8 cells; P = 0.0414, Student’s t-test).
C1. α5β4 KO mice: Bars (mean percentage of currents relative to controls ± SEM, n = 8 cells) show the absence of effects of α-conotoxin AuIB on nAChRs in SCG neurons of α5β4 KO mice. The application of 5 μM α-conotoxin AuIB for indicated periods of time does not significantly inhibit peak currents (one sample Student’s t-test with reference to a hypothetical 100 %: P10 sec = 0.1173; P130 sec = 0.5057; P250 sec = 0.0935). C2. Time- and concentration-dependent inhibition by α-conotoxin MII of nAChRs remaining in SCG neurons of α5β4 KO mice. Triangles down: 10 nM (n = 8 cells); triangles up: 30 nM (n = 11 cells); circles: 100 nM α-conotoxin MII (n = 6 cells). Data points are the mean percentages of currents relative to controls ± SEM (shown if error bars exceed symbols). Note that a 130 sec exposure to 100 nM α-conotoxin MII blocks 95 % of the currents. C3: Slow and partial recovery of the inhibition by 30 nM (triangles up, n = 9 cells) and 100 nM α-conotoxin MII (circles, n = 6 cells).

