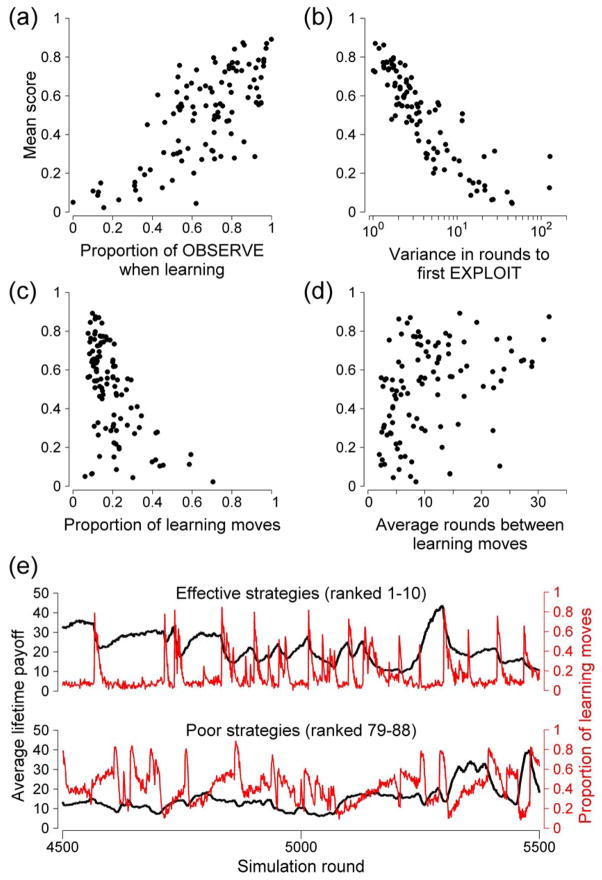
Figure 2.
Key variables affecting strategy performance. (a) Final score plotted against the proportion of learning (i.e. INNOVATE or OBSERVE) moves that were OBSERVE in the first tournament stage. (b) Final score against the variance in the number of rounds before the first EXPLOIT. (c) Final score against the proportion of rounds spent learning in the first tournament stage. In both, each point represents the average value for one strategy. (d) Final score against the mean number of rounds between learning moves. (e) Time series plots of the per-round average individual mean lifetime payoff in the population and proportion of learning moves, from 1000 simulation rounds run under identical conditions with the final stage contestants (top panel) and the strategies ranked 79–88 in the first tournament stage (lower panel).

