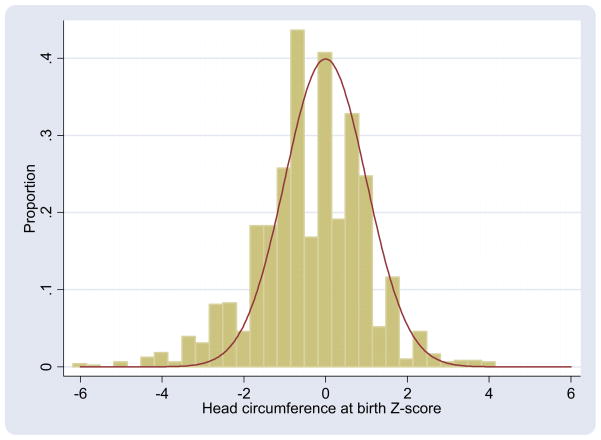
Figure. Observed and expected distributions of birth head circumference Z-scores.
Vertical bars represent narrow groupings of head circumference Z-scores in extremely low gestational age newborns study sample. Expected normal distribution of Z-scores (red line; mean = 0, SD = 1) is overlaid.
McElrath. Factors associated with small head circumference at birth among ELGAN. Am J Obstet Gynecol 2010.

