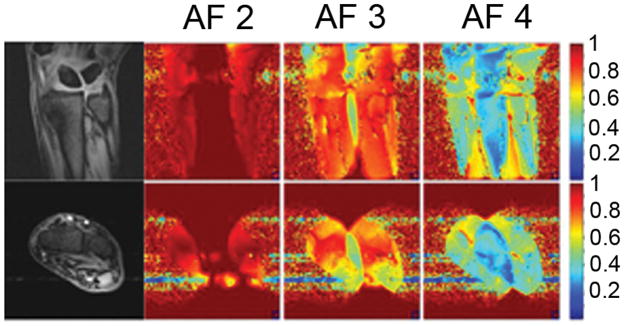
Figure 4.
Maps of the inverse g-factor (1/g) for acceleration factors (AF) 2, 3, and 4. These were determined from the coronal (top row) and axial (bottom row) images of the wrist of a healthy human volunteer. All maps are rendered with the same color scale for comparison; low values (blue) show areas with high g-factor.

