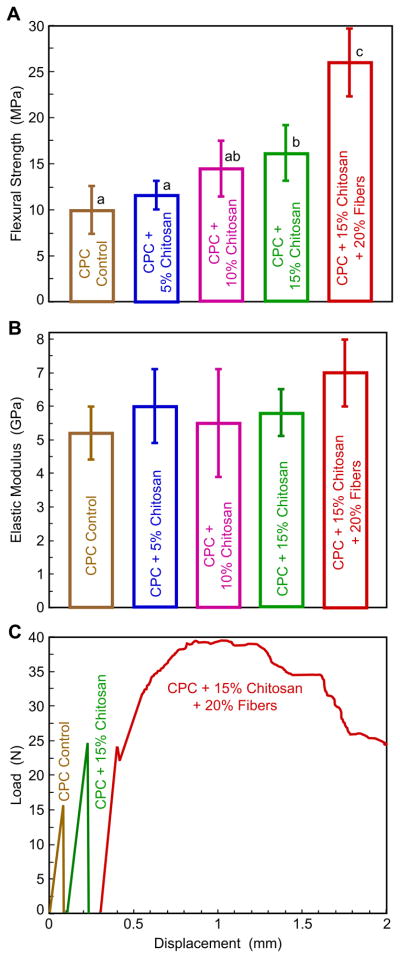
Fig. 1.
Results of single-load fast fracture. (A) Flexural strength, (B) elastic modulus, and (C) load-displacement curves. Each strength or modulus value is the mean of six measurements, with the error bar showing one standard deviation (mean ± sd; n = 6). In (A), values indicated by dissimilar letters are significantly different (p < 0.05). In (B) all the values are statistically similar (p > 0.1). In (C), CPC with 15% chitosan and 20% fibers showed a tough, non-catastrophic failure mode.

