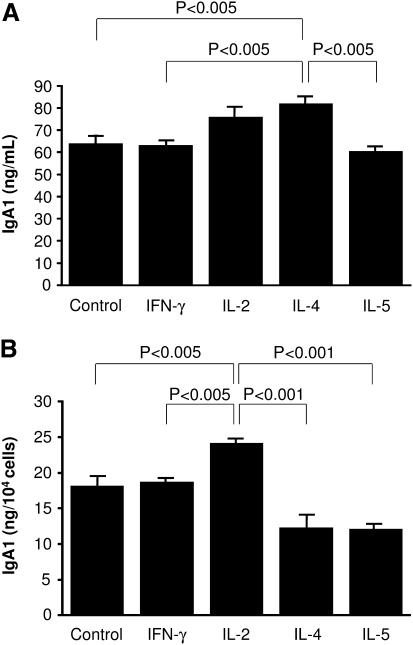
Fig. 2.
IgA1 production in response to cytokine stimulation. IgA1 concentration of supernatant was determined by sandwich ELISA. (A) IgA concentration of supernatant from cytokine stimulated cells. IgA1 content of supernatant from IL-4 stimulated cells was significantly higher than that of cells incubated with other cytokines, except for IL-2, and control (P < 0.005). (B) IgA1 production per cell stimulated by cytokine. Production of IgA1 from each cell stimulated by IL-2 was significantly higher than that of other cytokines or control (P < 0.005). Results are expressed as mean ± SE.

