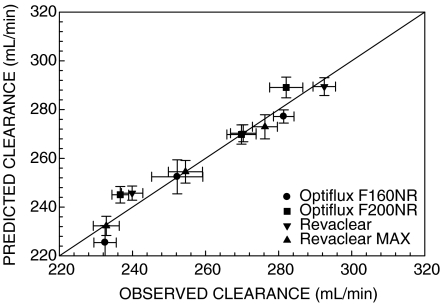
Fig. 2.
Predicted urea clearance versus measured urea clearance. Urea clearance predicted using the Michaels equation and a constant KoA (derived from experimental data for QD = 500 mL/min) did not differ from the measured clearances at dialysate flow rates of 350 and 800 mL/min. Data are presented as mean ± SEM for n = 12. The solid line is the line of identity.

