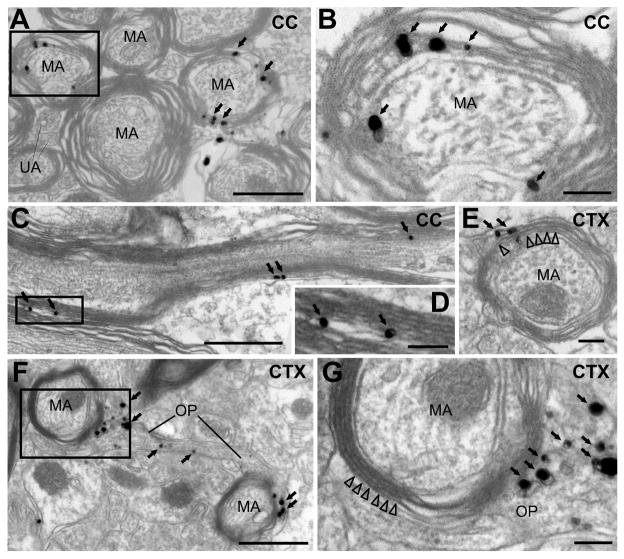
Figure 4. Oligodendrocytes generated from NG2+ cells form myelin.
Electron micrographs of the corpus callosum (A – C) and cortex (E – G) from PDGFαR-CreER;ROSA26-mGFP mice at P30+150 showing silver-enhanced immunogold labeling of EGFP. Arrows highlight silver particles located within myelin sheaths, and arrowheads in E and G indicate myelin. Black boxes in A, C and F are shown at higher magnification in B, D and G, respectively. MA, myelinated axon; OP, OL process; CC, corpus callosum; CTX, cerebral cortex. Scale bars = 100 nm (A, C, F) or 500 nm (B, D, E, G).

